
E – ElasticSearch : (Store, Search, Analyze)
This solution helps you securely take data from any source, in any format, search, analyze and visualize it in real time.
In our case, we will be using it for security analytics and logging database used to store logs like windows event logs, syslogs, firewall logs it allows you to search across your log data; it uses ESQL – elasticsearch query language. It also uses RESTful APIs and JSON – allows you to interact with the elasticsearch database ina a programmable way as required. (https://www.elastic.co/)
L – Logstash: (Connect, collect, Alert)
A data processing pipeline that ingests data from many sources, transforms it and sends it into your Elasticsearch.
Logstash helps you:
– pick your log input or source which includes servers, web applications, data stores etc.
– Filter your data; you can filter per event ID from each data log source and send only that data to your log destination, saving resources
– Push your data to analytics platforms like Elasticsearch
K – Kibana : (Explore, Visualize, Engage)
it allows you to use a web console to query for logs stored in the elastic search instance. allows you to build dashboards etc. Kibana allows you to search data, create visualizations, create reports and create alerts
In layman terms:
Elasticsearch is like a magic search engine. It helps people find specific data really fast.
Logstash is an organizer. It takes all the data from different places and organizes them so Elasticsearch can find them easily.
Kibana is like a picture book. It shows you fun pictures of your data inthe form of dashboards etc so you can see everything clearly.
Benefits of the ELK stack:
1. Centralized Logging: meet compliance requirements and search data in case of a security incidence
2. Flexibility: beats / agents allow you to customize your ingestion; customize the kind of log data you want into your elasticsearch or logstash
3. Visualizations: will let you observe information at a glance – business executives and management love this (fancy dashboards) – and they dont have much time, lol
4. Scalability: Easy to configure to handle larger environments; scales well horizontally.
5. Ecosystem: many integrations and a rich community
* Many SIEMS are actually built on the ELK stack.
Some notes on Telemetry collection, you can use:
– Beats
– File Beat = logs
– Metric beat – Metrics
– Packet beat = network data
– Winlong Beat = Windows Events
– Audit Beat – Audit Data
– Heartbeat = Uptime
* depending on the telemetry you want to collect, you will install that beat on the endpoint
– Elastic Agents: These can collect multiple sources/types of data using one agent per host
Setup an Elasticsearch Instance
The Setup (Within Vultr):
ELK Server Component – Learn to spin up your own Elasticsearch Instance.
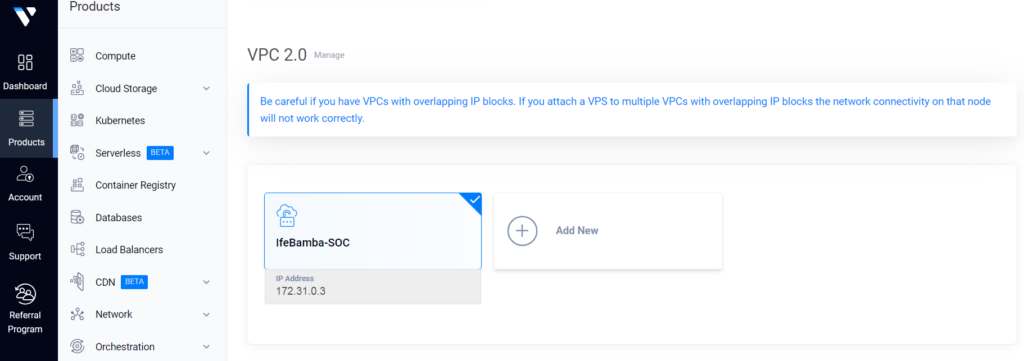
Firstly, we create a VPC (virtual private cloud) network, which is basically our own network within the cloud; VPCs are like VLANs on on-prem networks. Note that our VPCs can contain public and private subnets that are either accessible from the Internet or isolated from the outside world. We will create our server instances within this VPC
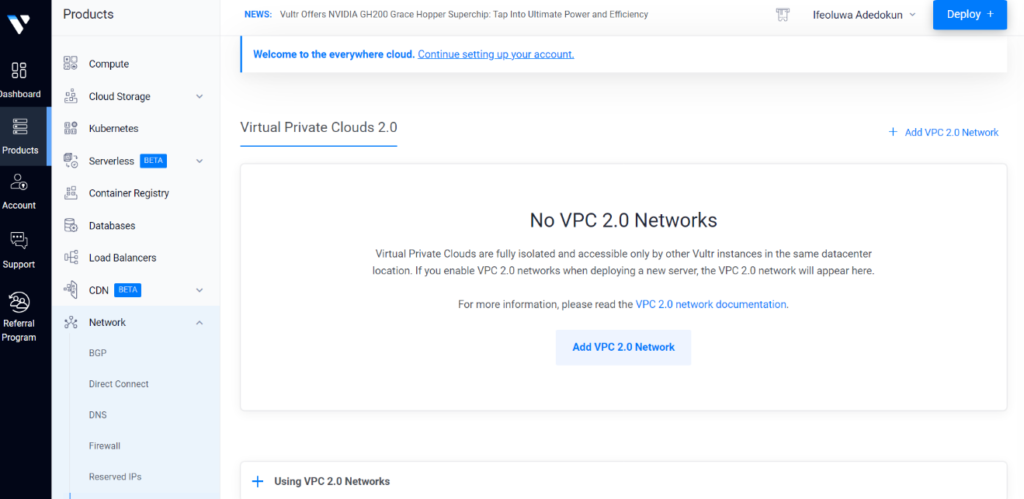
Add Network Location:
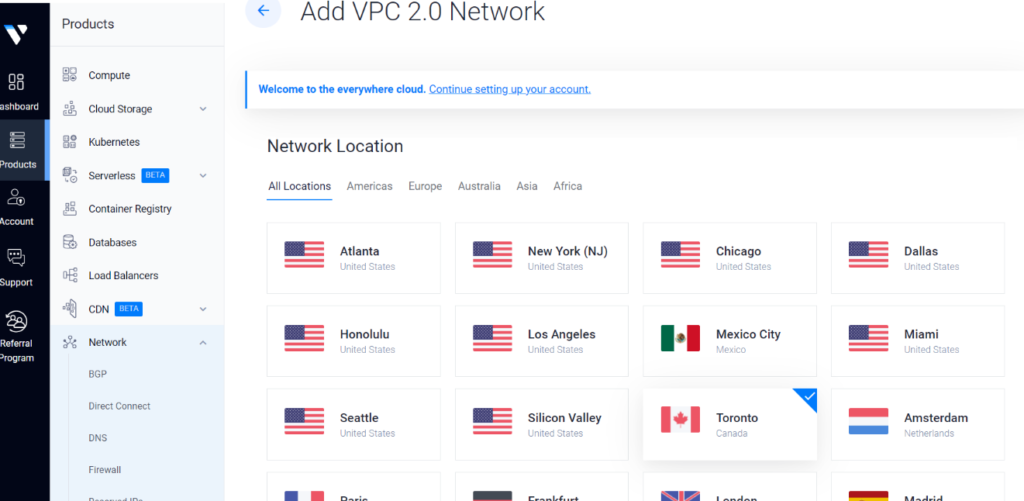
Note: Always create your instances (servers, compiuters) etc within the same network (geographical) location (in this case, Toronto where im based). i.e VPC network location = Toronto, Server instances = Toronto.
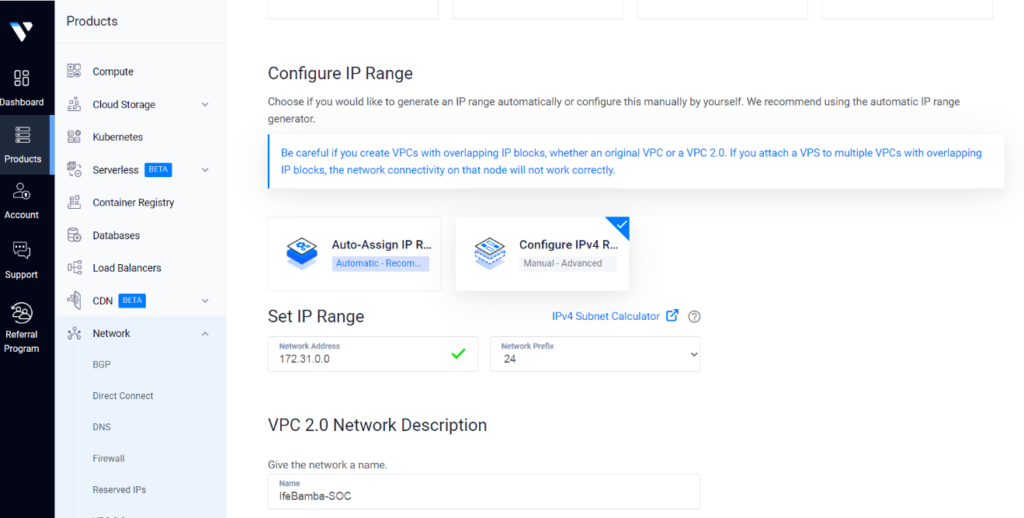
Next, Configure IP Range, and click on create your Network
Deploy a New Server:
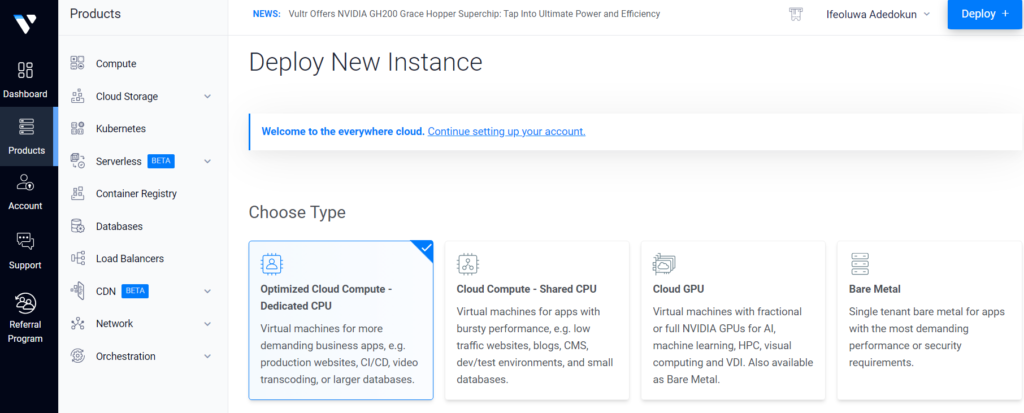
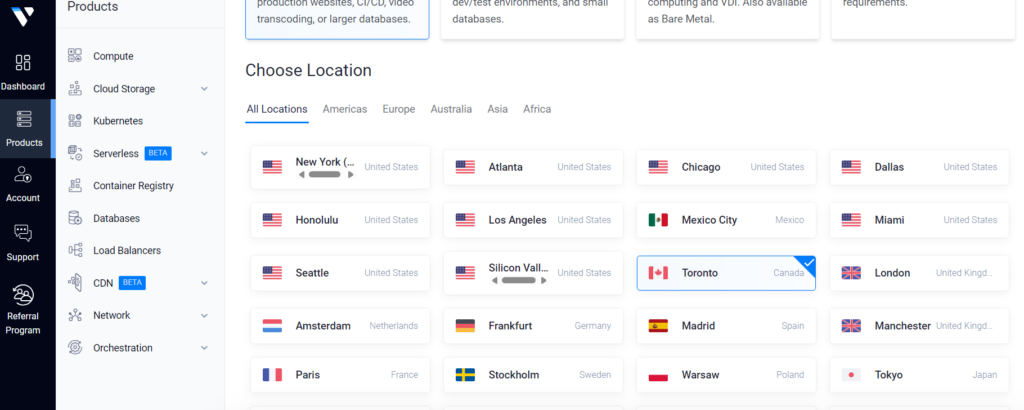
Select Location: Toronto (Same location as our VPC network created earlier)
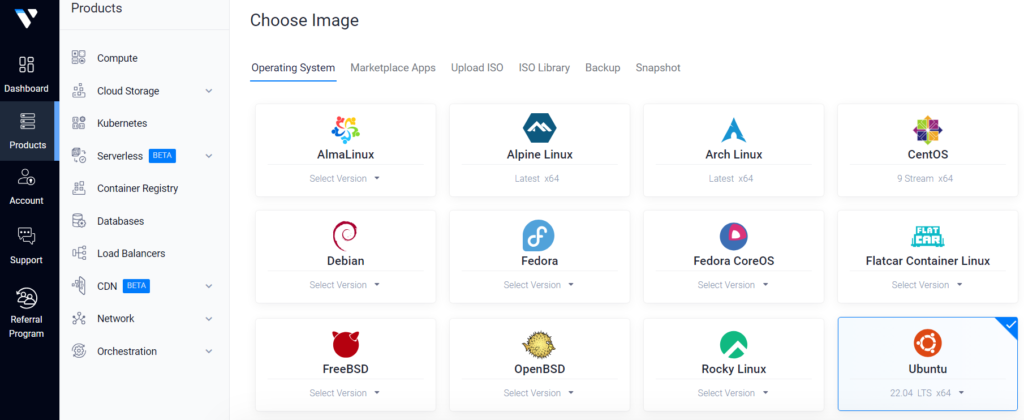
Select Server OS Image: Ubuntu, version 22.04
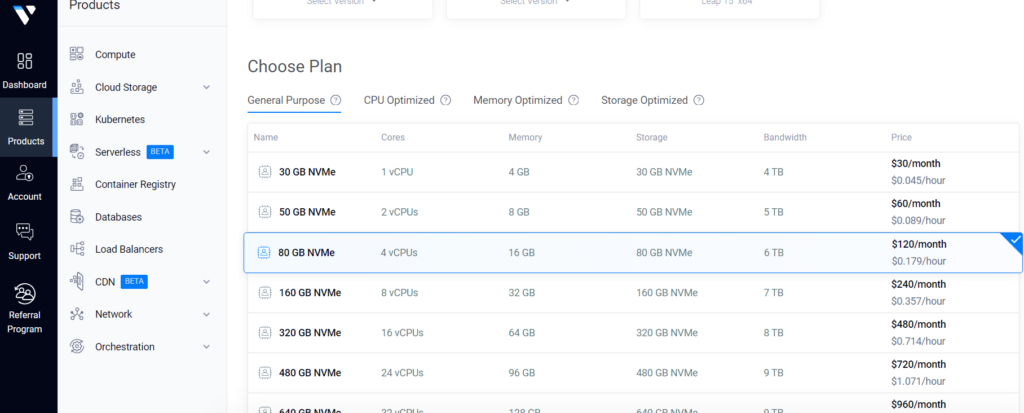
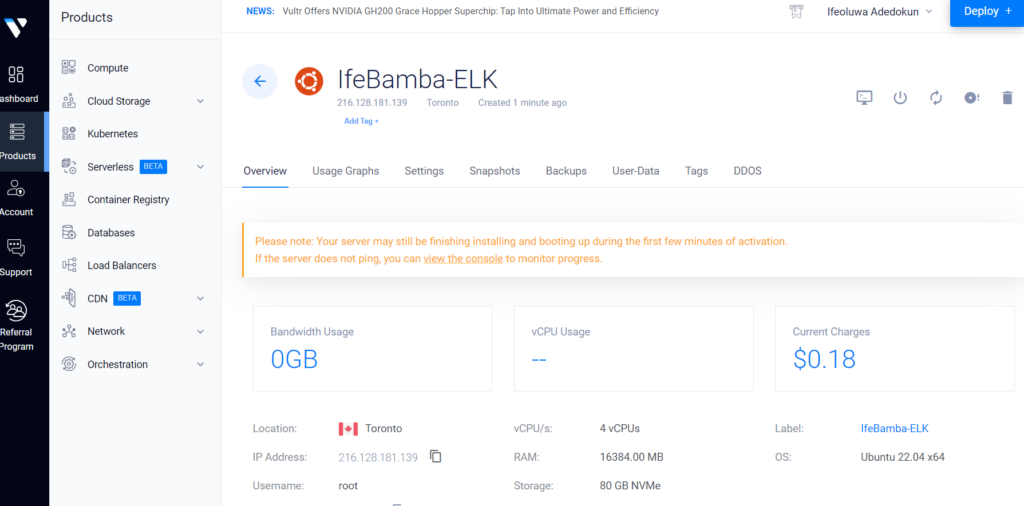
Select Plan specifications: 80GB NVMe, 4 vCPUs, 16gb memory and 6TB bandwidth
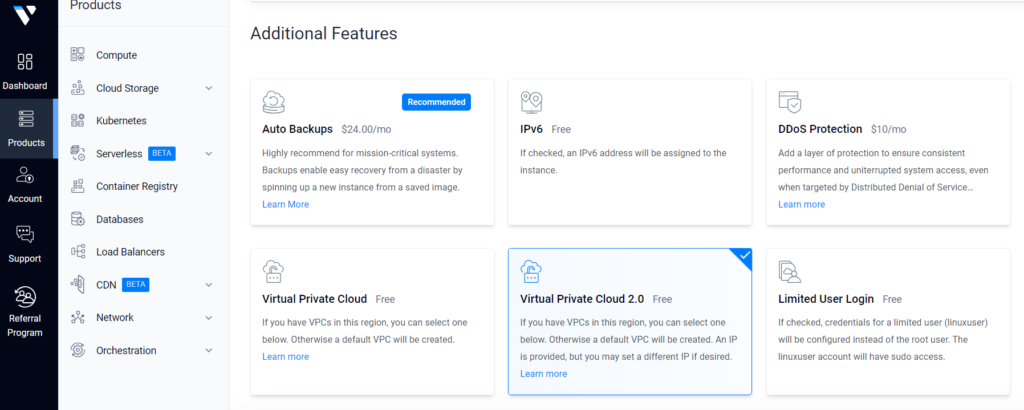
Note the IP address: 172.31.0.3
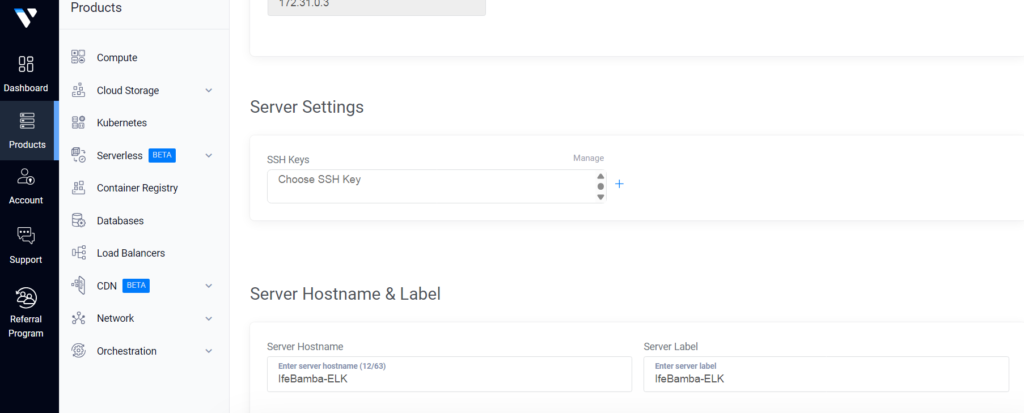
Next, input a server name; IfeBamba-ELK and Deploy
Server Provisioning….

Our Ubuntu Server Instance Deployed and ready:
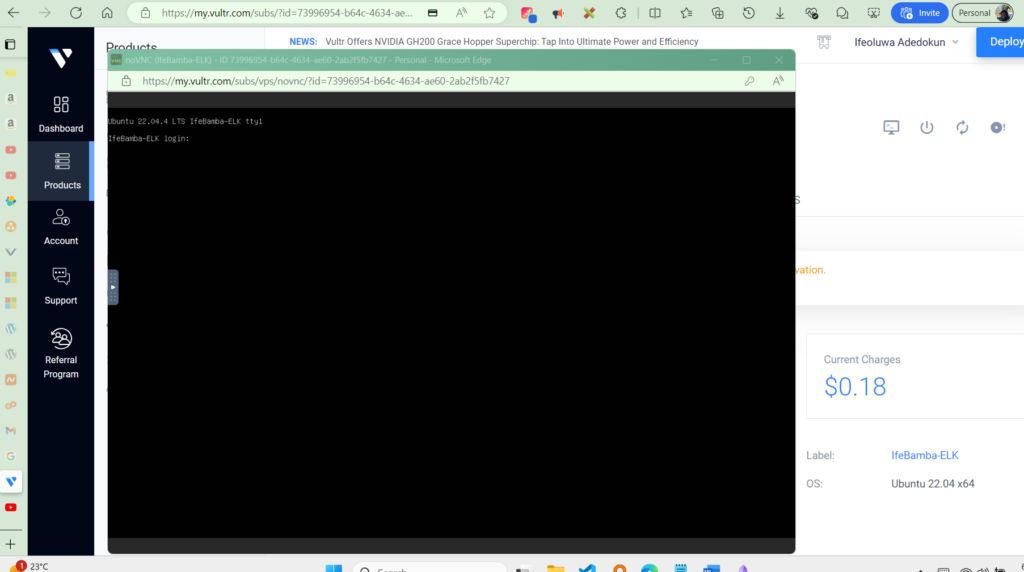
Clicking on the Console Icon will establish a VNC connection for us:
Or we could connect into the provisioned server from our local machine using SSH and the credentials provided in our server deployment (username, password and public IP address)
SSH Connection using Powershell:
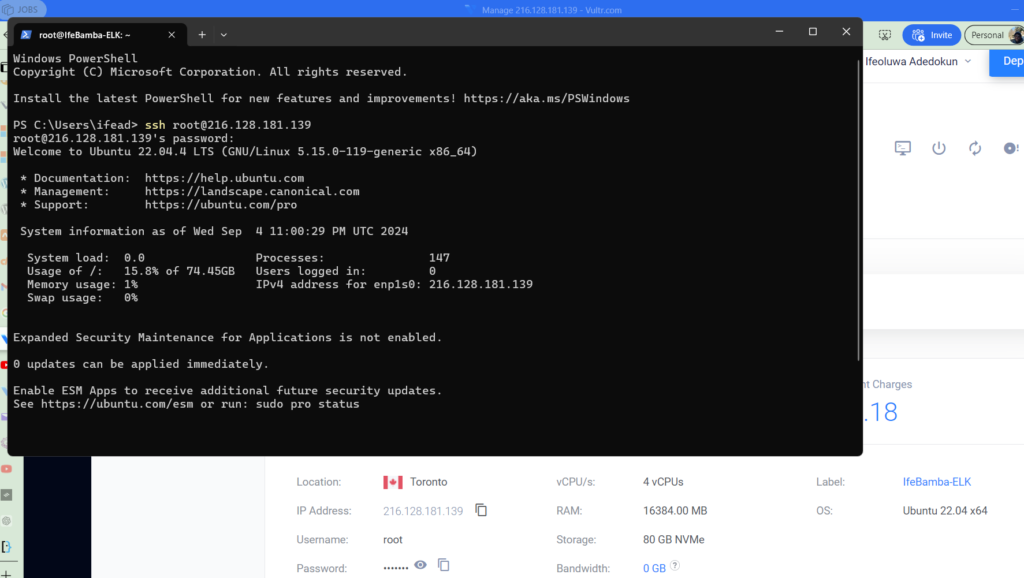
SSH Session established:

Next, as per best praactices dor new server installs, lets update our ubuntu repo:
> apt-get update && apt-get upgrade -y
Installing the ElasticSearch application component
Browse to the elastic website, select your platform, and get a download link and copy the download URL. We will Download Elasticsearch and install with the wget command within our SSH console
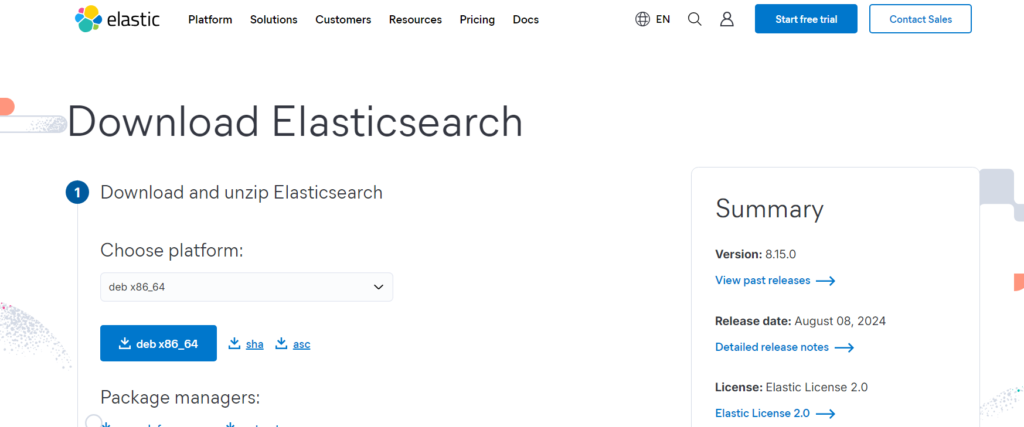
Use Wget to download the package:

List directory and Install with dpkg -i

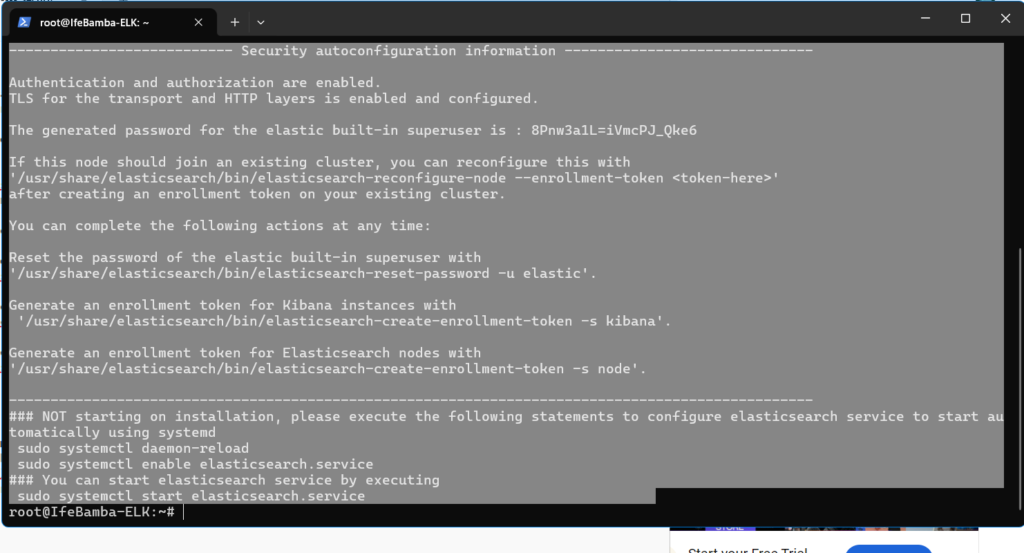
After installing, note the Security auto-configuration information information in the verbose logs generated while installing Elasticsearch, it will contain your Elasticsearch super-user password.
Next, we browse to the Elasticsearch configuration directory located in the /etc folder and edit the elasticsearch.yml file.
I will be editing the elasticsearch.yml file using the vi editor in linux.

We uncomment, and edit the network.host line and update it with our ELK instance IP
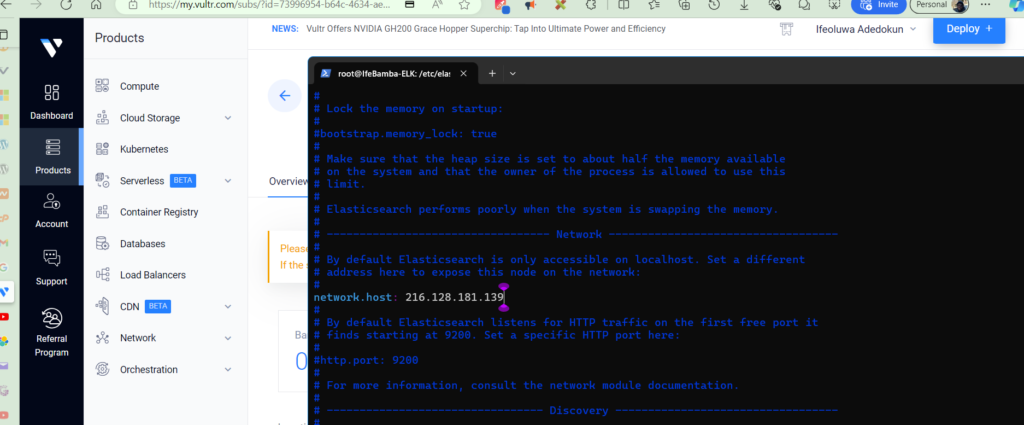
We will also, uncomment the http.port line of the configuration file.
These steps will allow anyone with credentials to access the Elasticsearch Instance. Our two line parameters of importance are:
Network.host: 216.128.181.139
http.port: 9200
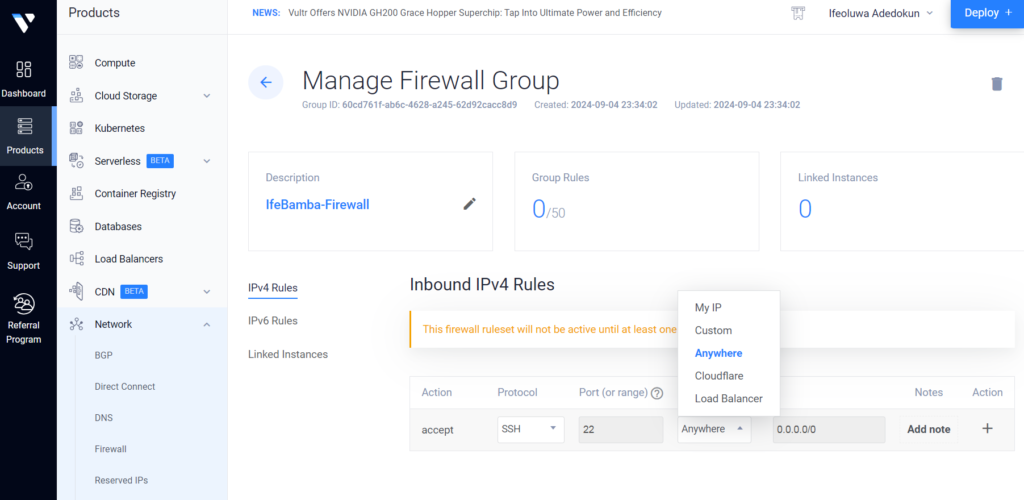
To prevent public access to our Virtual machines on the cloud, we can implement some firewall rules within the Vultr cloud service.
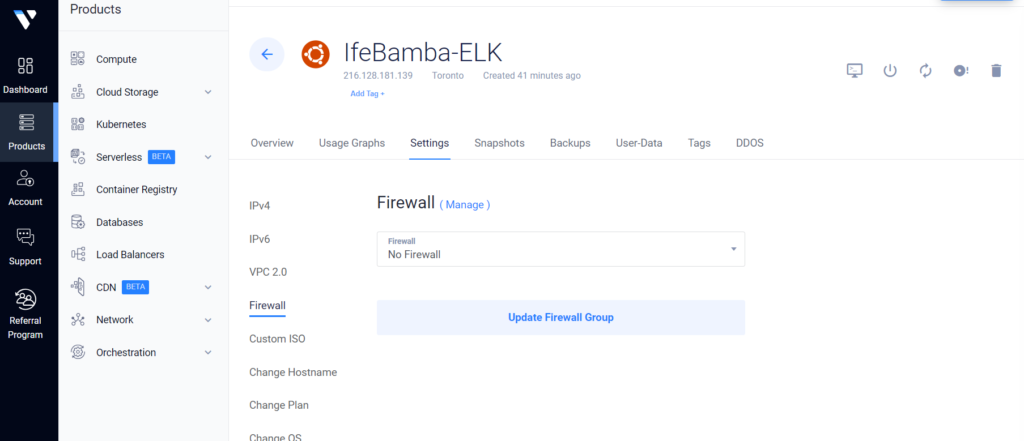
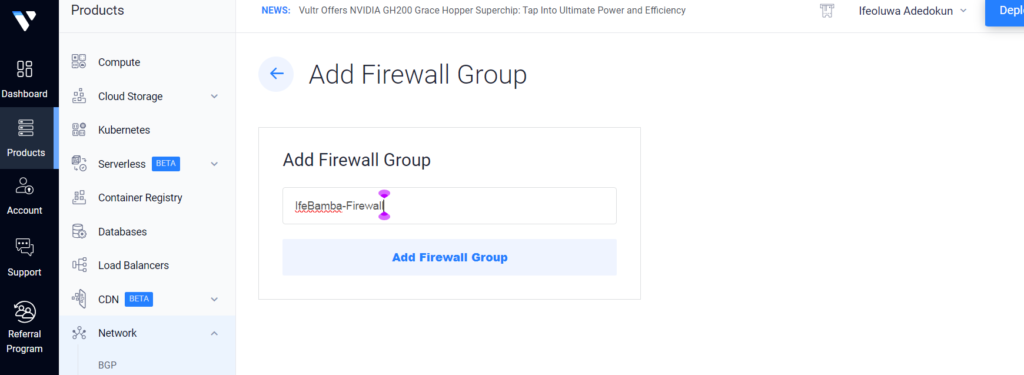
We can configure only our IP to have access to our VMs here:
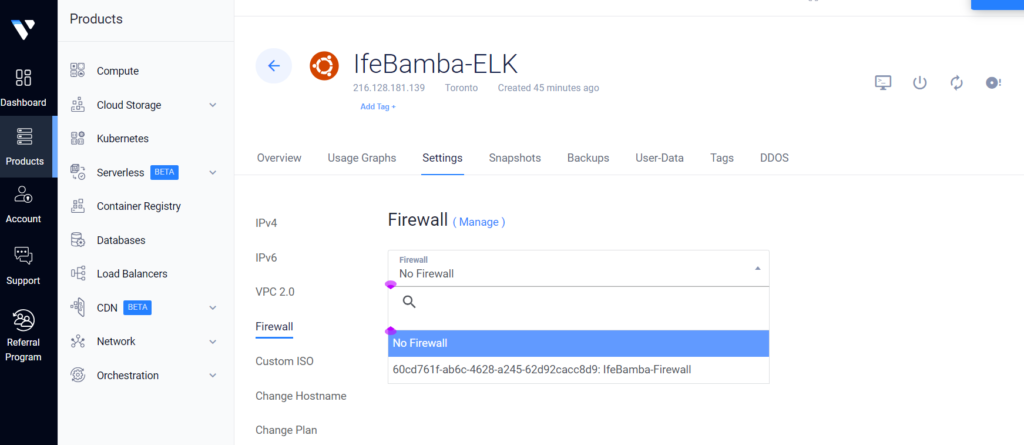
After creating the firewall group, we can apply it to our VM instance
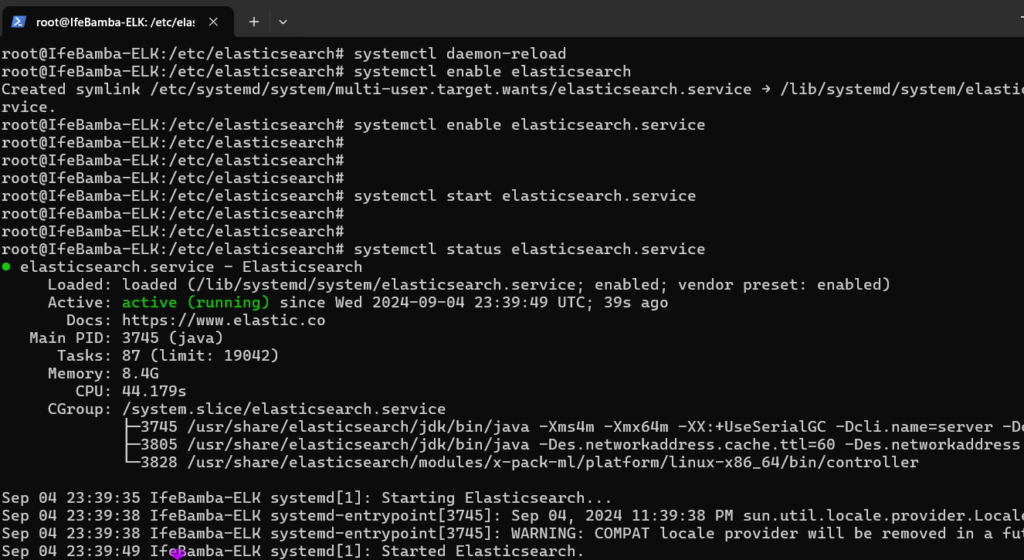
Next, we enable our Elasticsearch service:


Check Elasticsearch service status with systemctl
In the Next post, we will setup the Kibana component of the Stack.


