Understanding RDP
Used for communication between the Terminal Server and the terminal server client; it is encapsulated within TCP; uses port 3389.
RDP can be exploited through the exposure of an RDP service on a server.
There are free online Services to use when looking for open ports on servers on the internet:
You can use some services to see a list of exposed servers over the internet that have the RDP port 3389 or other ports open!
- shodan.io
- censys.com
How to prevent RDP abuse:
- Turn it off if not in use.
- Use MFA
- Restrict access (using firewall rules, or use a VPN)
- Use Better passwords
- Don’t use Default accounts, you can create another administrator account.
Creating Alerts and Dashboards in Kibana -Windows (RDP)
Log into ElasticSearch and drill into the windows Agent:
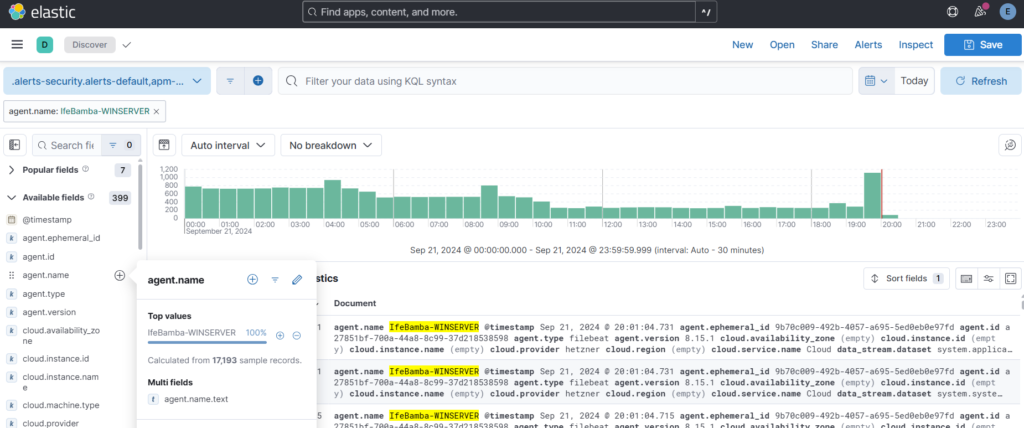
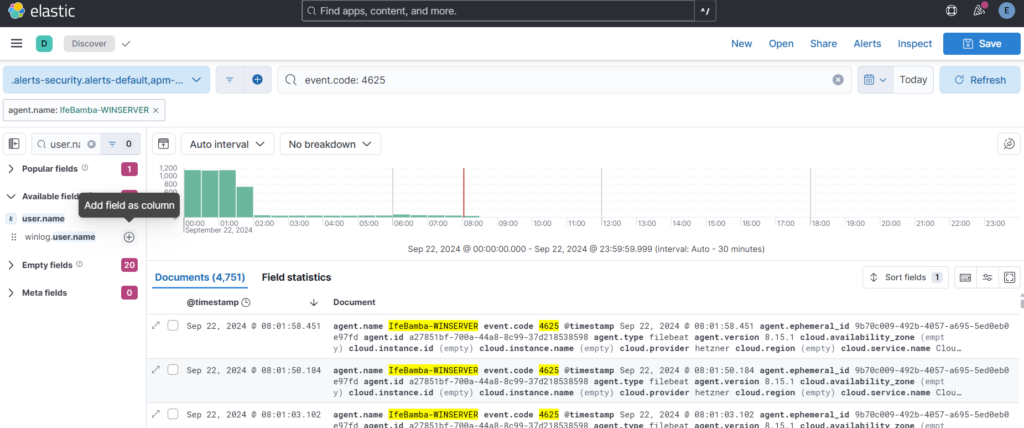
Next , since we are looking for failed login (bruteforce) attempts on the windows server, we search for the windows event ID for failed login attempts: which is EventID 4625
We search this code in our logs:
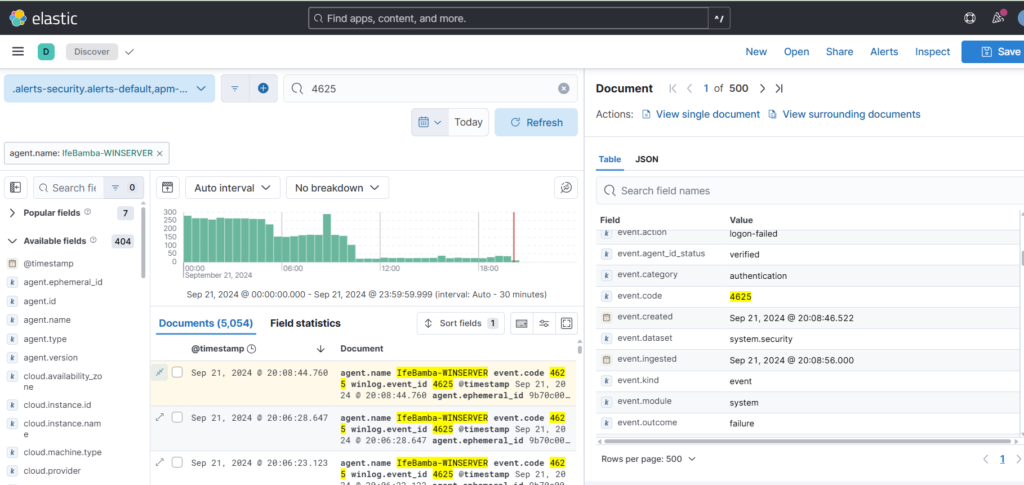
This filters out our logs, and we expand one of the log entires to find out that the Field that handles this is the “event.code” field in ES.
Next we search the query: “event.code: 4625” to ensure we only have entries that match this result.
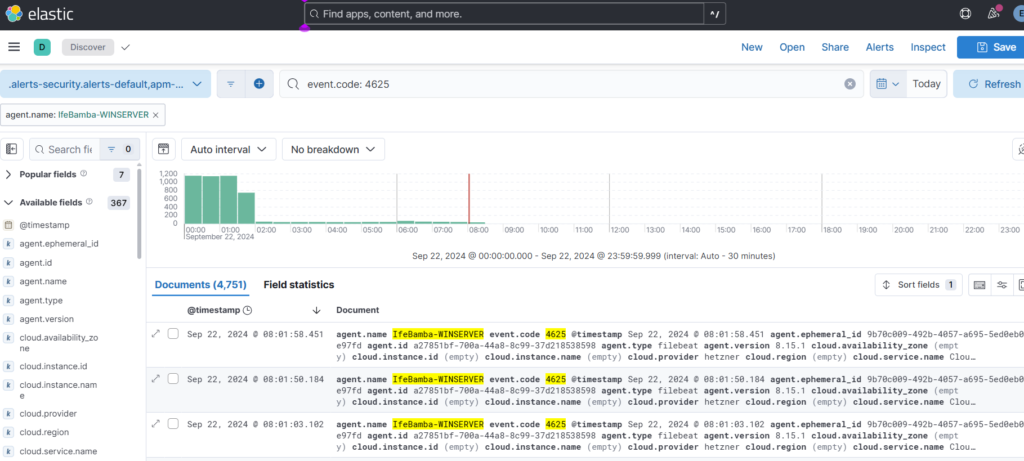
We then add user.name and source.ip fields to our data display: then Add field as Column
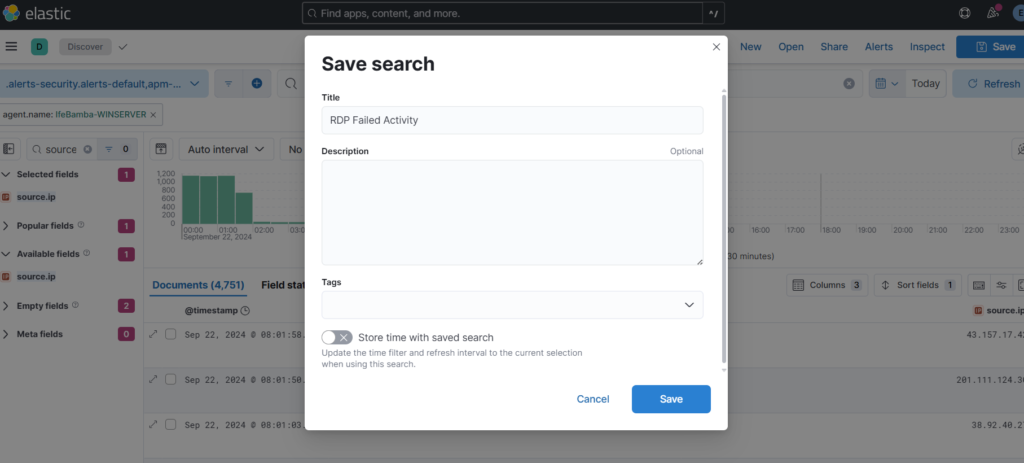
Save Your Query:
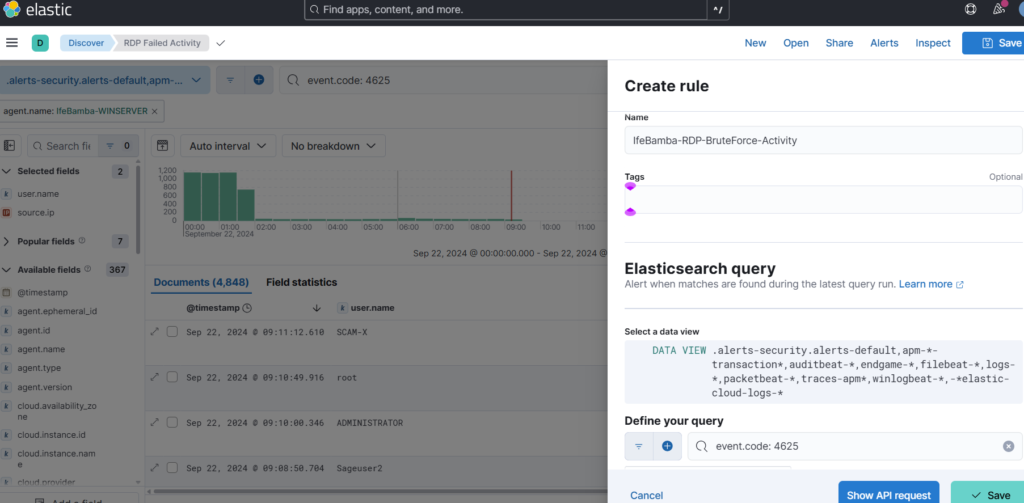
Next we create our Alert through Alerts > create threshold rules

Creating Alert with Parameters:
Create a name, and also ensure your define your query is with the event.code : 4625 query.
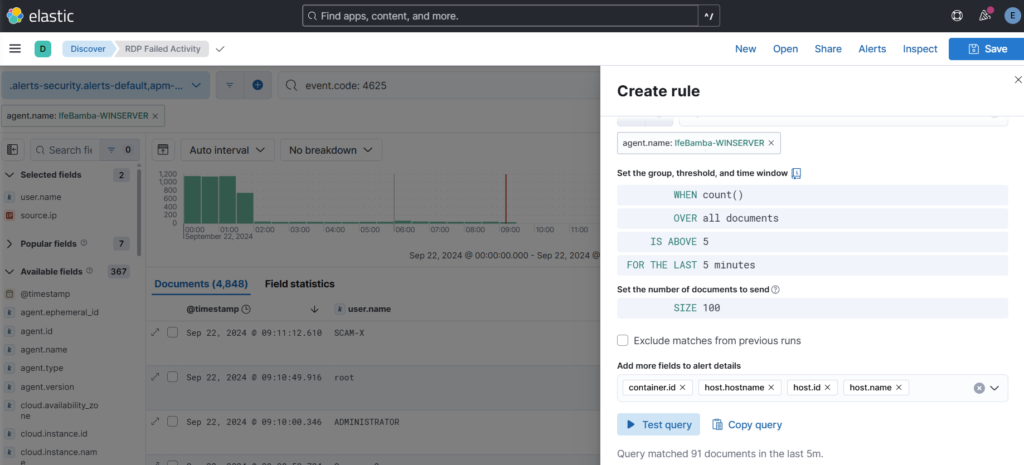
We modify the alert rules to trigger an alert whenever we have over 5 attempts in the last 5 minutes! And Test the Query and Save.
How to Check for Alerts that may have been generated on our ES.
ElasticeSearch > Management > Stack management > Alerts (on the sidebar)
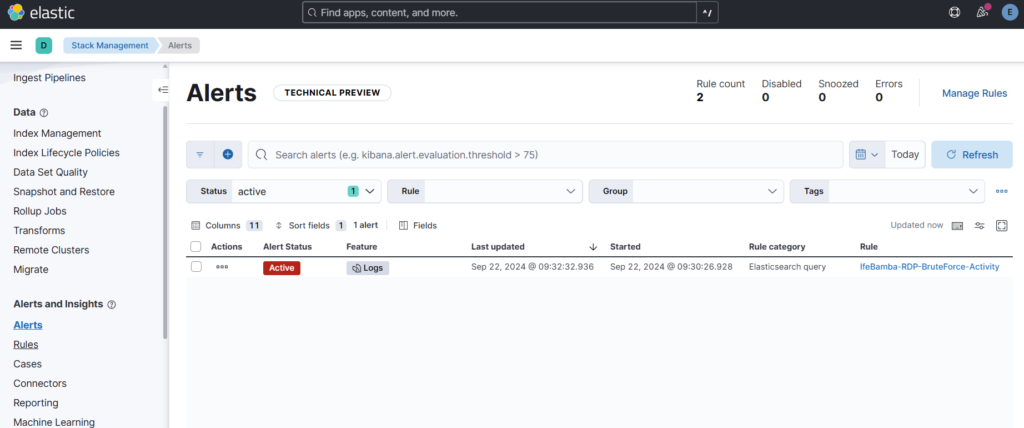
We see above that an alert has been generated for our RDP rule.
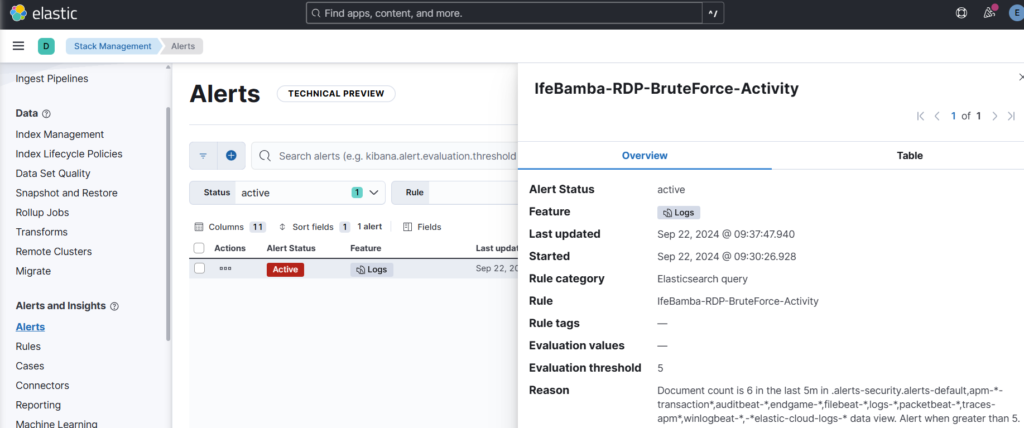
Note: creating alerts as done above creates limited information, the approach to see detailed information with details such as source IP, account used etc, we need to create a Rule.
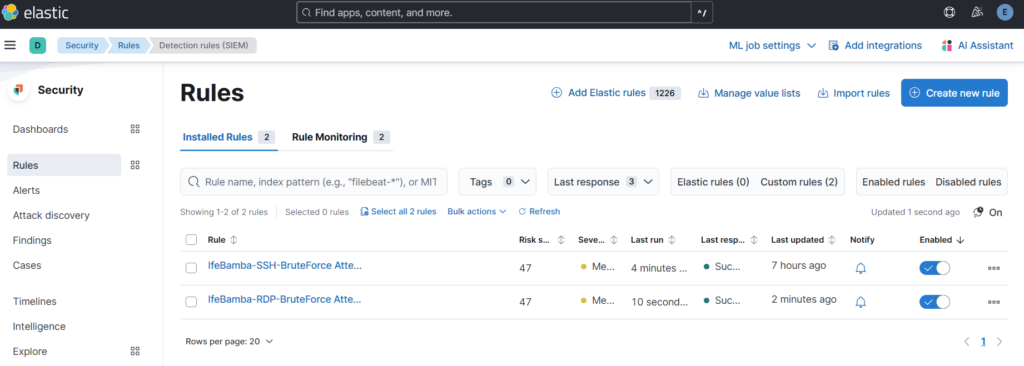
Elasticsearch > Security > Rules

Lets create a new rule for our LINUX SSH server :
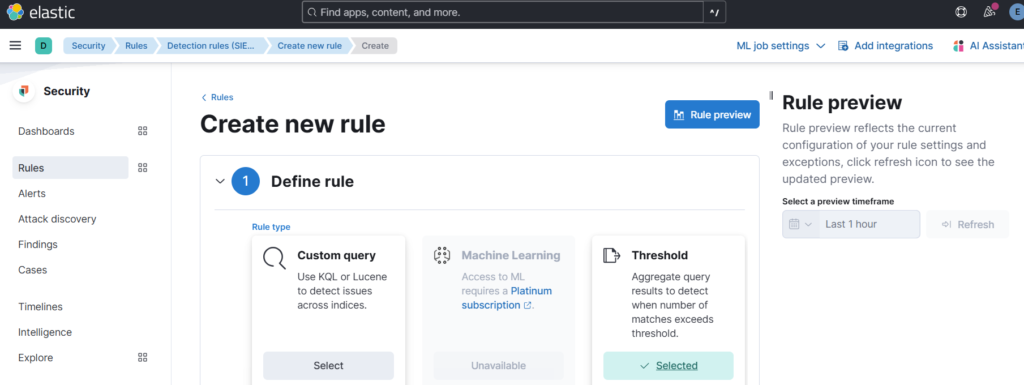
Click on Detection Rules (SIEM), then click on Create New Rule:

Create new Rule > Select threshold
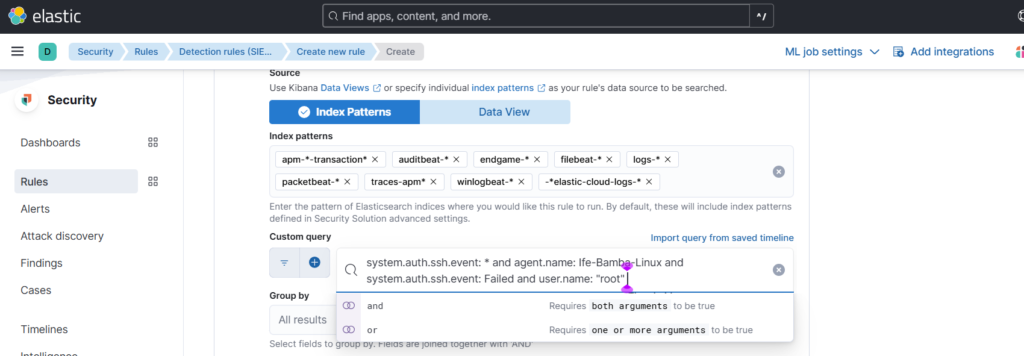
Scroll down to the custom query section and use the following query:
“system.auth.ssh.event: * and agent.name: Ife-Bamba-Linux and system.auth.ssh.event: Failed and user.name: root”
Also, group by user.name and source.ip fields, you can change the threshold to 5 instead of 200:

Select Required Fields and click continue:

Give the Rule a Name and select severity, select highlighted fields:
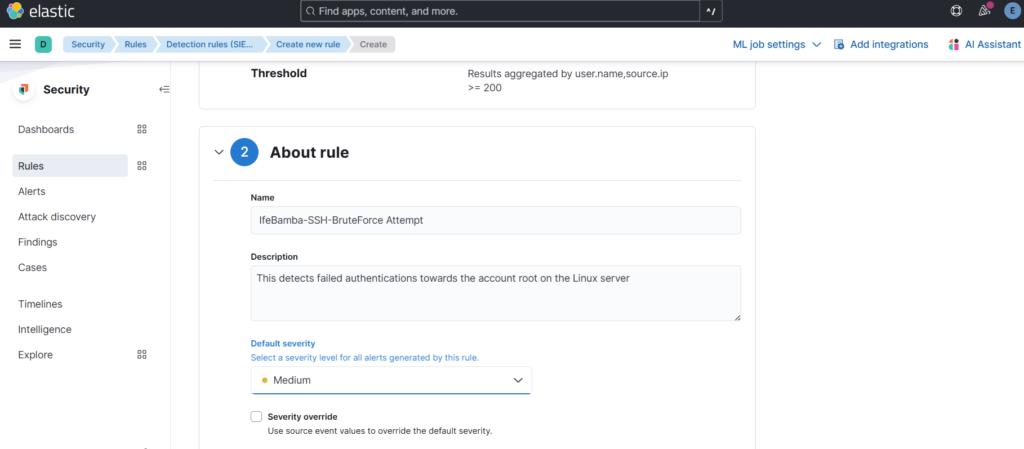

Schedule Rule: to time the frequency of the execution of this rule

Create and Enable the Rule:

Rule Summary:
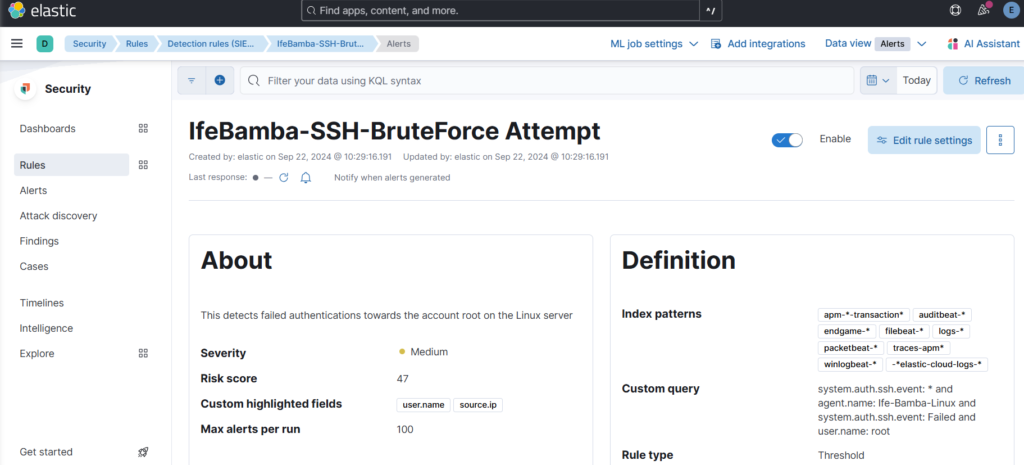
Lets create a new rule for our WINDOWS RDP server :
Click on Detection Rules (SIEM), then click on Create New Rule:
Create new Rule > Select threshold
Scroll down to the custom query section and use the following query:
event.code: 4625 and agent.name: IfeBamba-WINSERVER and user.name: Administrator

Required Fields; enter: user.name and source.ip and click Continue!
Give the Rule a Name and select severity, select highlighted fields, click Continue:
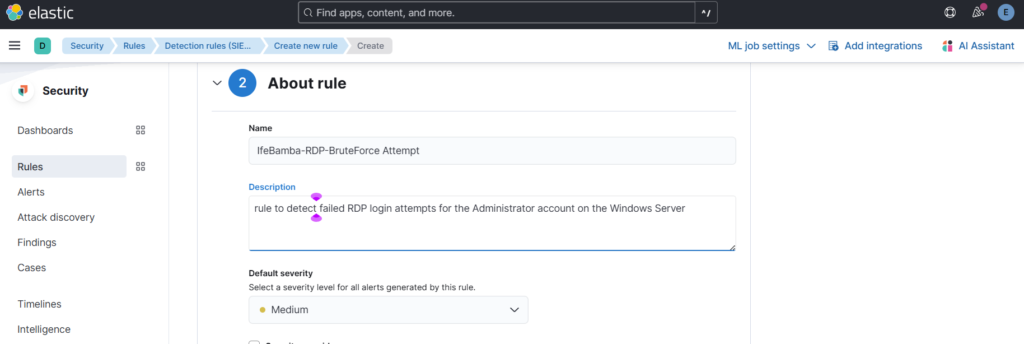
Schedule rule > continue > Create and Enable Rule
