Investigating our recent mythic activity, we return to ES > Discover. Here we search for “svchost-ifebamba.exe” which is our payload, we get some log information below:
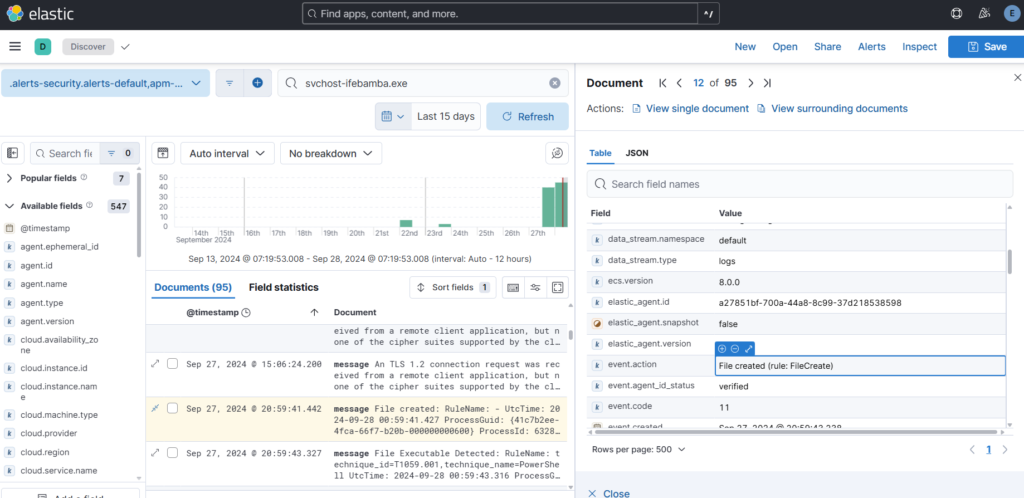

– we can see the file creation date
– event.code (11)
– other information such as process guid, user, file location, and the image (powershell)
sysmon event.code 11 includes process creation and overwriting processes, but we are only interested in process creations which is sysmon event.code 1.

Next we investigate the log entry and look for the hash

Sidenote: You can copy the SHA1 hash and look it up on a site like VirusTotal or other sources to correlate the file hash with what is publicly available – use OSINT (Open source intelligence) to your advantage.
Note: There is a field for original payload filename (apollo.exe) which can give you an insight into the attack, even through we renamed the file to svchost-ifebamba.exe:

To create a query for this particular type of malware payload, we can use field such as: original filename and hash; you can customize your query to fit your unique scenarios; this uses the fields: winlog.event_data.OriginalFileName and winlog.event_data.Hashes combined with the event.code: 1 (process creation)
Using the hash, origianl file name and event code:

You can save the search.
Next ES > Security > Rules > Detection Rules > Create New Rule > create custom Query, scroll down and insert your query

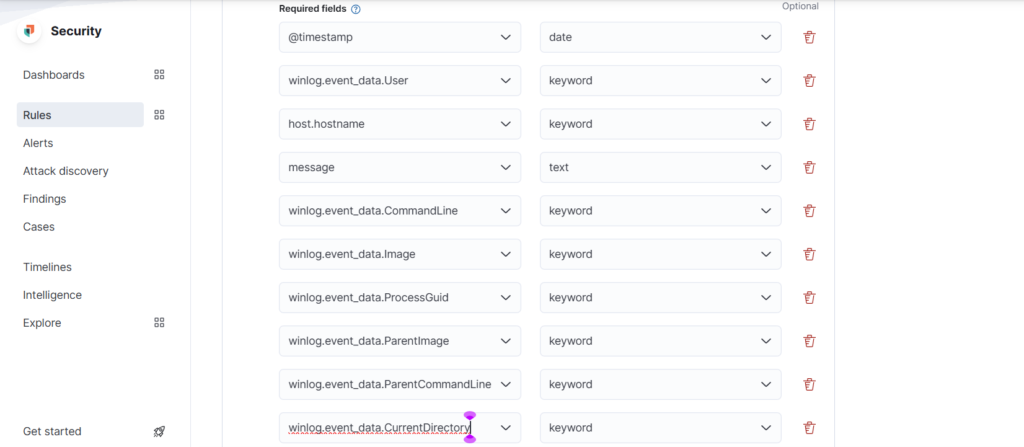
Select Required fields from the log details:
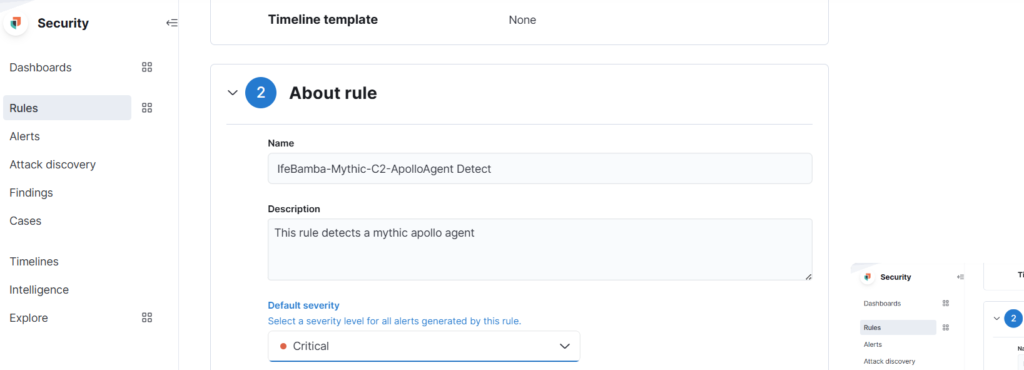
Name the Rule, set the severity, schedule etc > create and enable rule:
Lets create a dashboard with the following parameters:
–
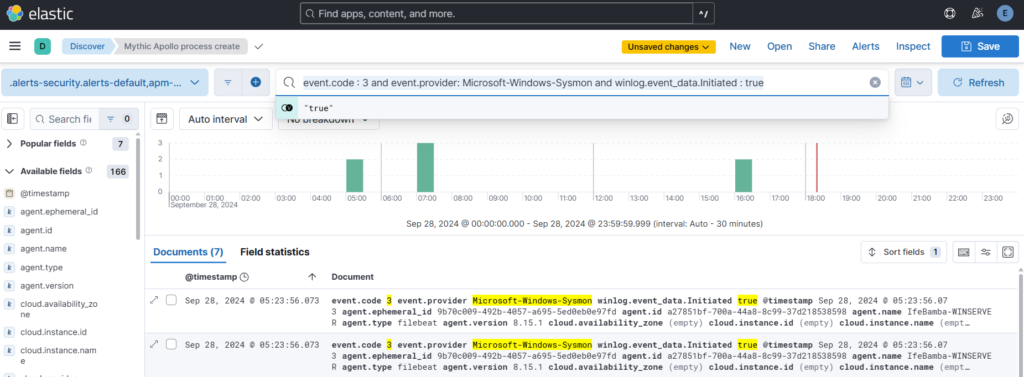
Event ID 3: Network connections (external); any processes INITIATING a network connection outbound
Event ID 1: Process creations – powershell, cmd, Rundll32 generated by sysmon
Event ID: 5001 – Windows defender activity (disabled)
Next: ES > discover ….form your query
Event ID 1: Process creations – powershell, cmd, Rundll32 generated by sysmon
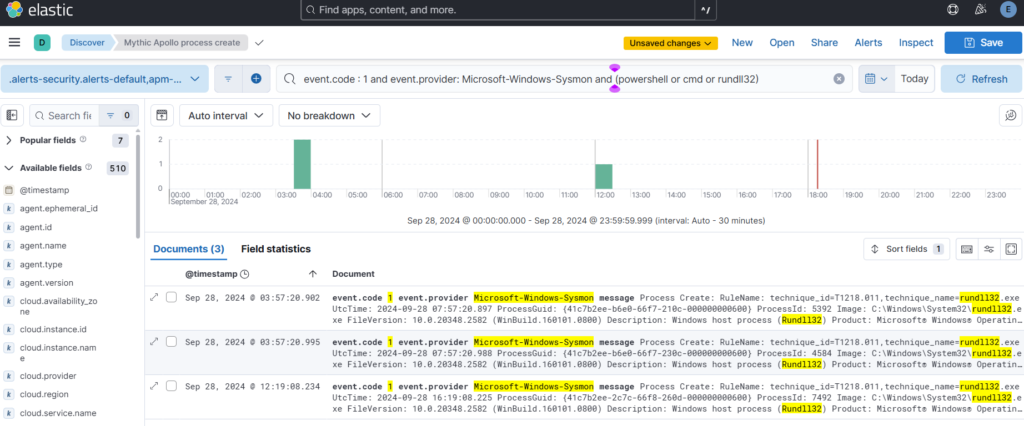
Event ID 3: Network connections (external); any processes INITIATING a network connection outbound
Event ID 5001: Windows Defender

Create Dashboards:
ES > Analytics > dashboards > Create Dashboards > Create visualization
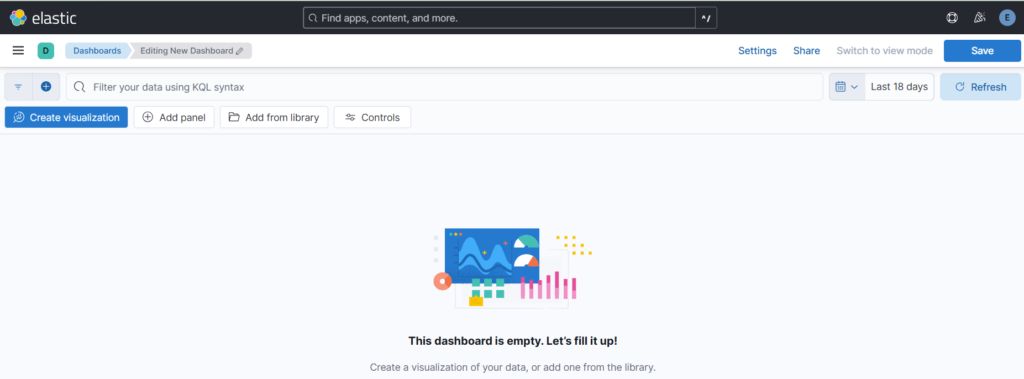
Drag the required fields into the dashboard and save:
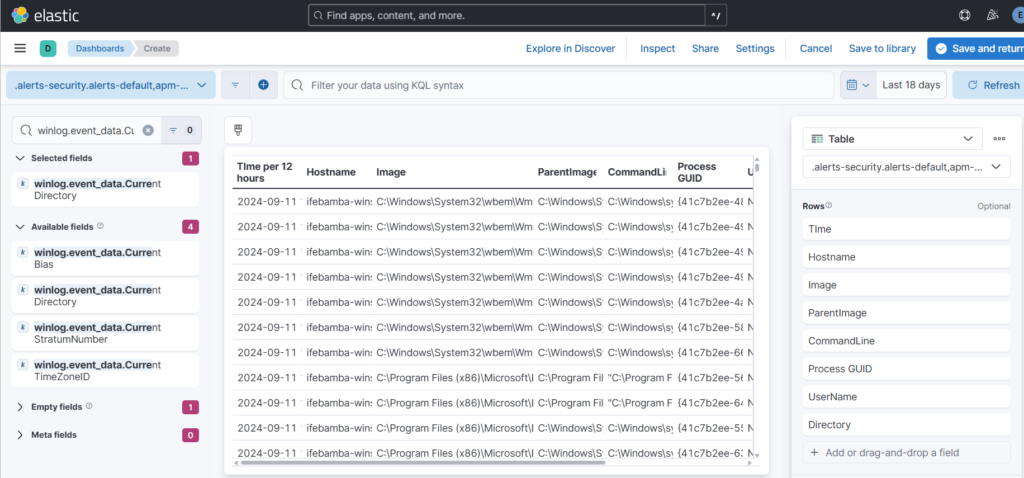
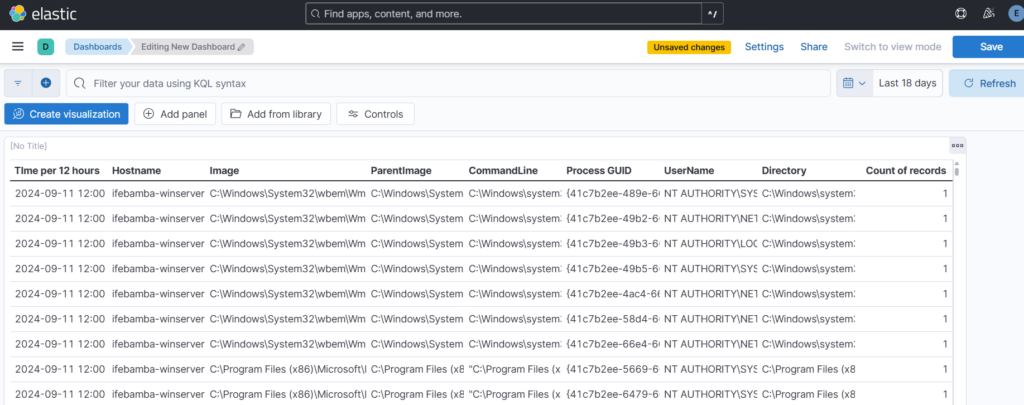
We follow the same process to create dashboards for Event ID 3 and 5001.
The Queries are below:
event.code : 3 and event.provider: Microsoft-Windows-Sysmon and winlog.event_data.Initiated : true
event.code : 5001 and event.provider : “Microsoft-Windows-Windows Defender”
The steps to generate your dashboard are summarized as:
input your query > expand on the log entries results to select specific fields that you would like to display on your dash > copy those field names to a notepad > ES > Analytics > dashboards > Create Dashboards > Create visualization >search for the field names you copied to the notepad earlier and drag them into the canvas in the center of the screen > You can rearrange the order of your field rows > select your display type; table, barchart etc > you can click on each field row in the right sidebar of the dashboard and edit its parameters such as appearance, number of entries etc.


