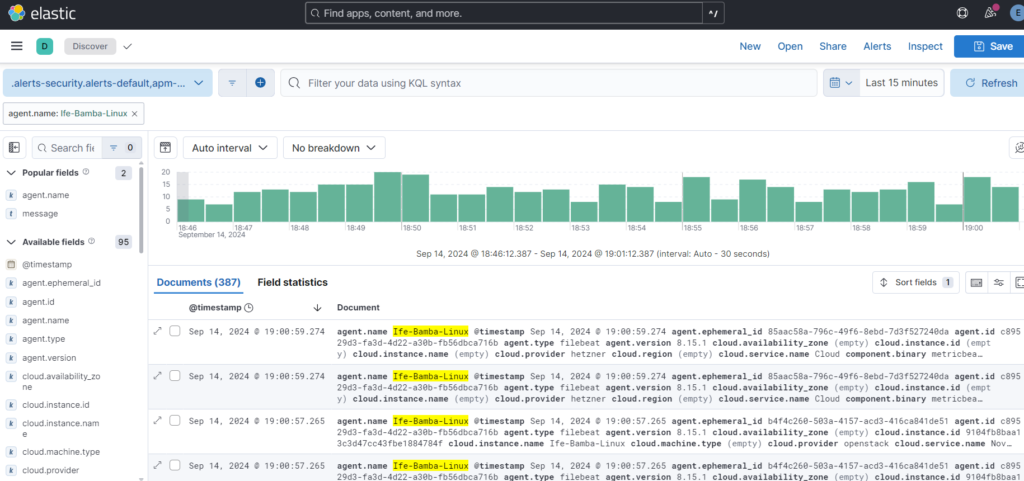
Events generated for our Linux Agent is seen below, we have a total of 387 events.
In creating our dashboards, we will be focusing on the following fields:
- Failed attempts
- User
- Source IP
We click the event.dataset filter on the left sidebar, the click on the system.auth field in the pop-out dialog box.
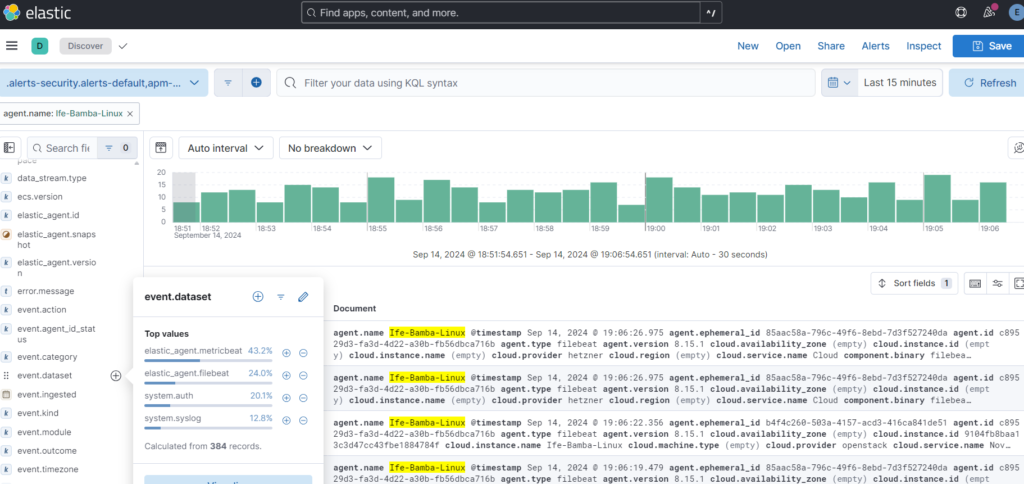
This narrows down the filtering from the agent logs, to the subset of the event.dataset : system.auth. We can further explore other filter options to gather more relevant data…
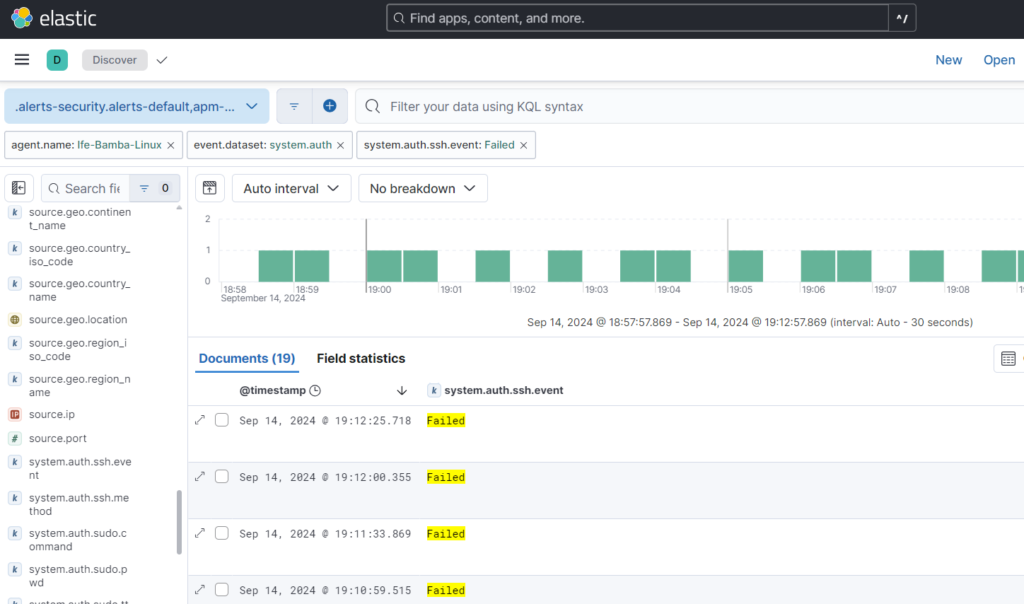
So, we try the system.auth.ssh.event filter on the left sidebar; if we click the “+” arrow, we get to see the “failed” subset of the filter:
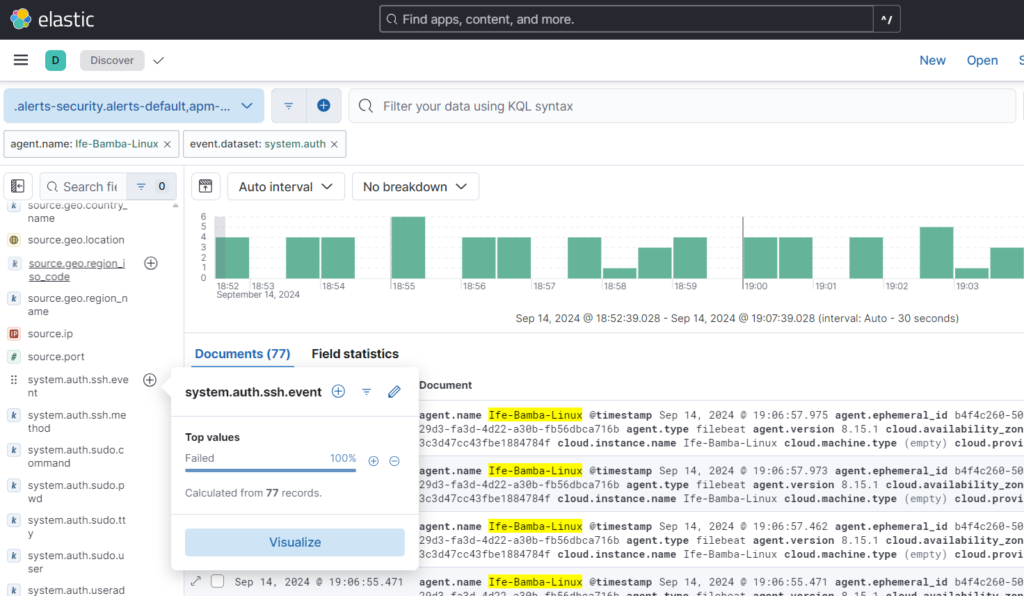
You can see your filter trail on the top part of the Elastic interface

We filter down to failed events: WE NOW HAVE A FAILED EVENTS FIELD
Filtering for a username field, we see a filter named user.name
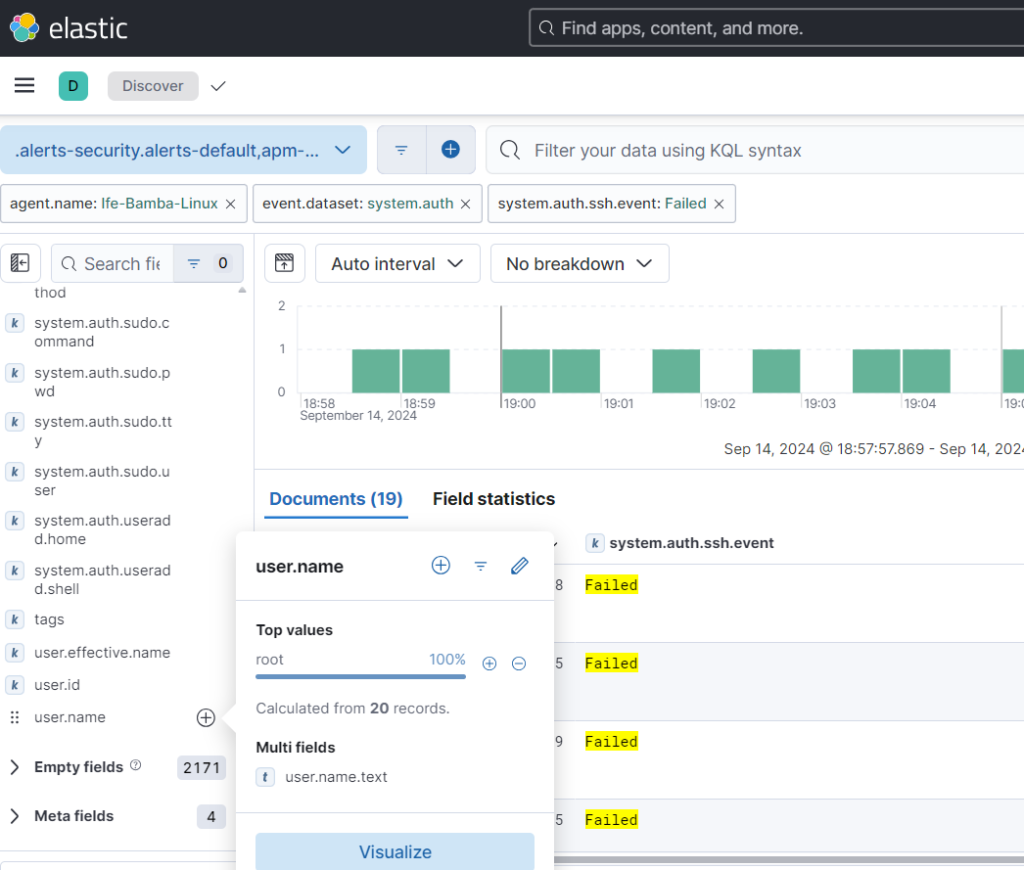
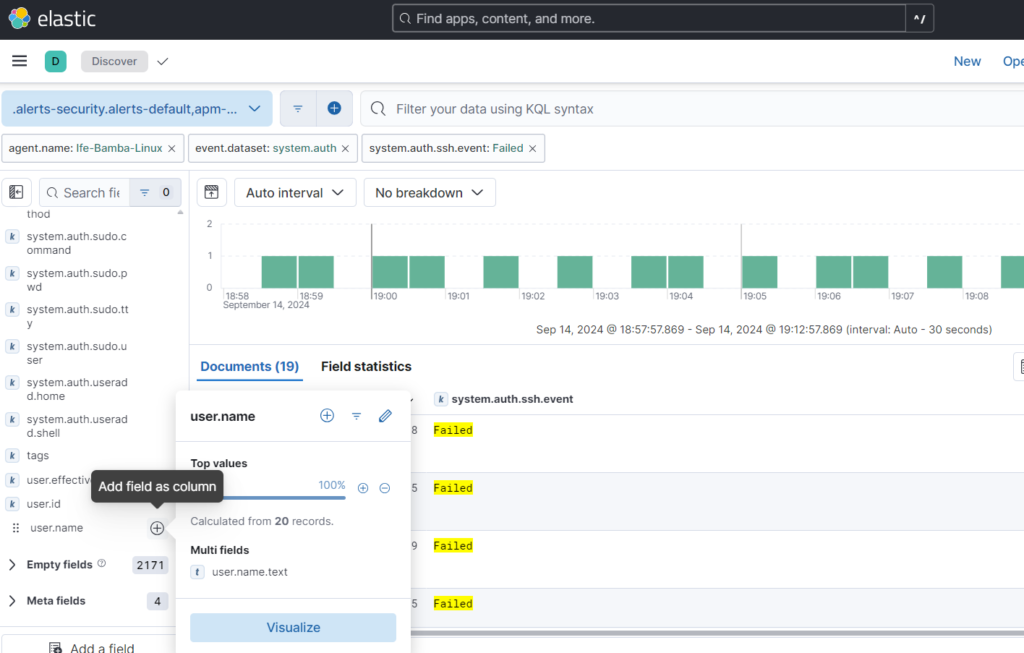
We can add this field as column to the fields on display:
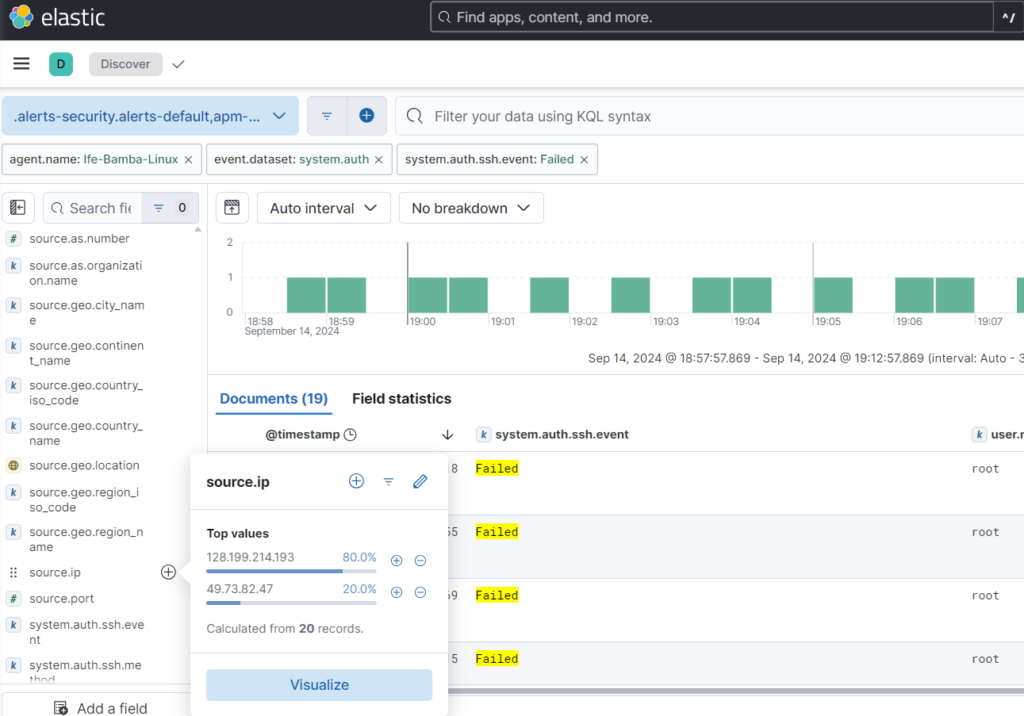
Next we seek for the SOURCE IP Field; we add it to our field display
We save our Query:
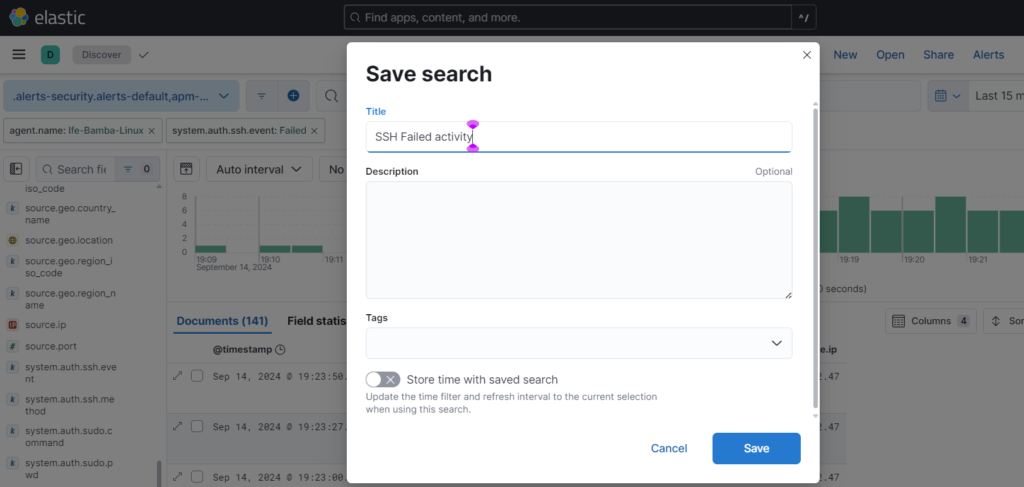
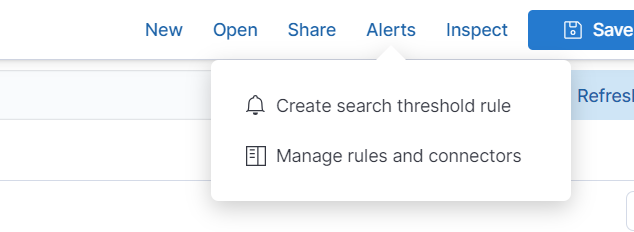
To create alerts: Click on the Alerts link:

Click: Create search threshold rule:
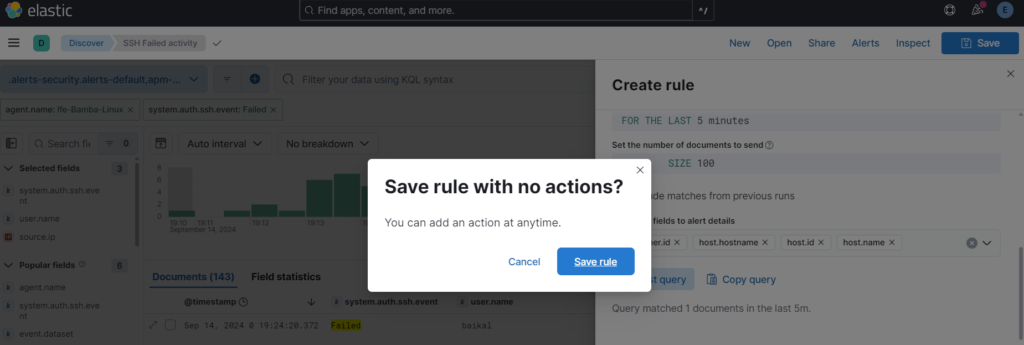
Create Rule name:

We define the Alert parameters:

this says if the number of failed login attempts (brute force attacks) is more than 5 within the last 5 minutes, trigger an Alert!
Click on “Test Query”

This shows that there are 1 event within the last 5 minutes!
Save the rule – we will create Actions later!
Next we Build our dashboard. Click on the Sidebar menu > Analytics > Maps
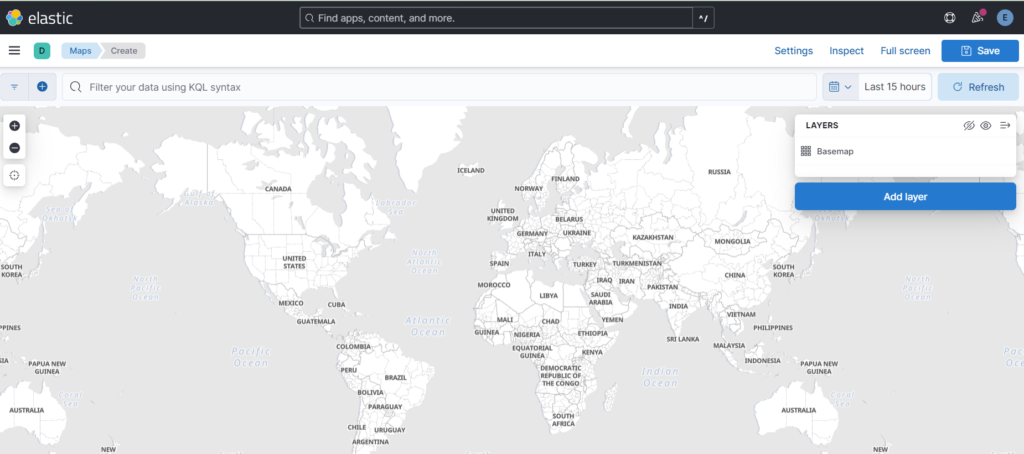
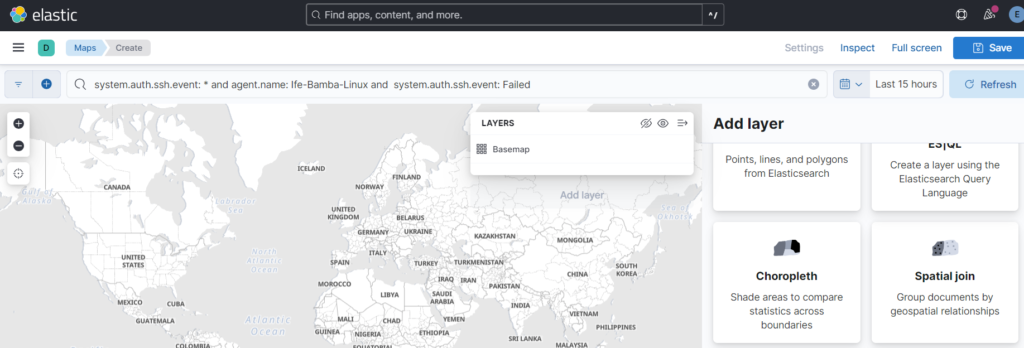
We need to recreate our query in the filter field of the maps page:
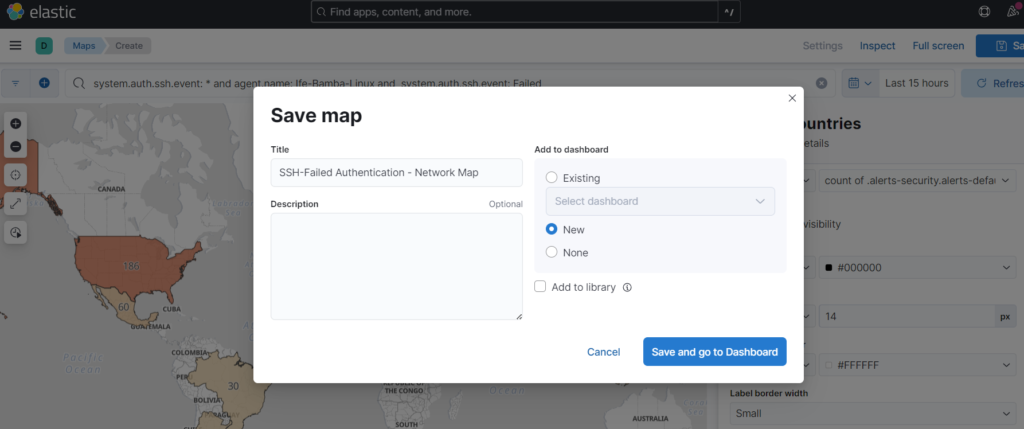
system.auth.ssh.event: * and agent.name: Ife-Bamba-Linux and system.auth.ssh.event: Failed

Next, click on Add layer, Scroll down and Select Choropleth Layer (to shade layers where activity is coming from)
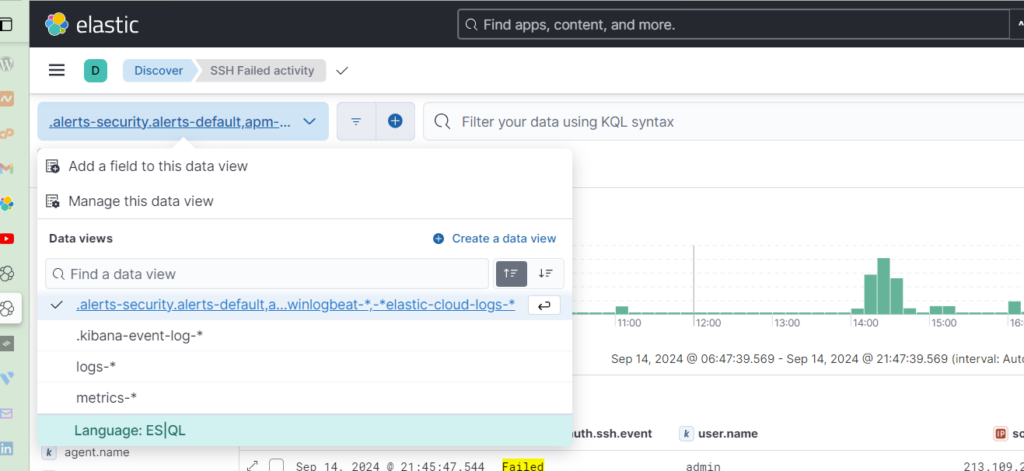
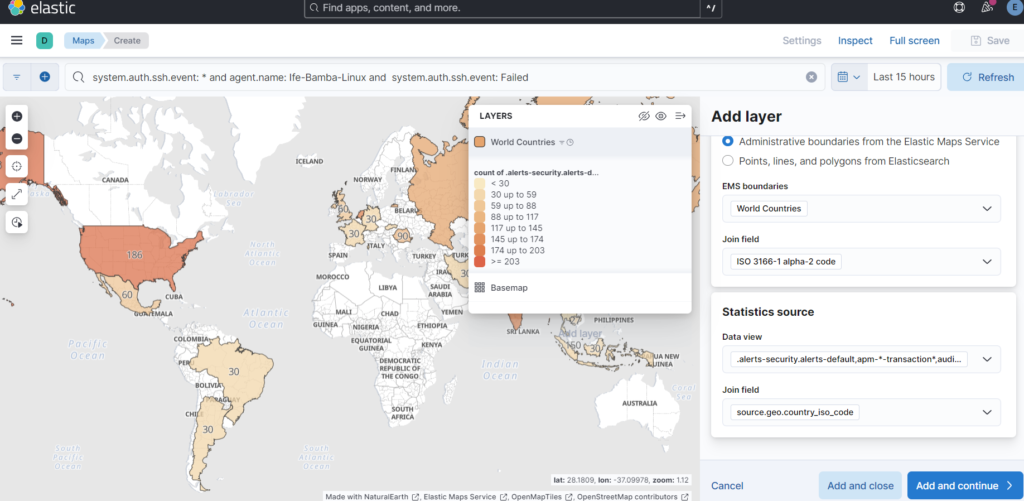
Select Administrative Boundaries, EMS boundaries: World Countries and Select the Dataview that You have been using (Can be found on the Discover page)
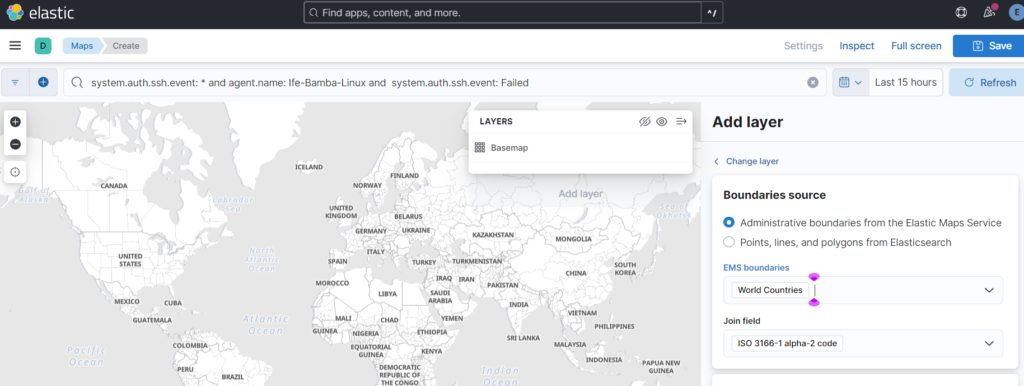
Statistics Source : source.geo.country_iso_code

Click on Add and Continue
Click Save, add a title, Add to Dashboard: new
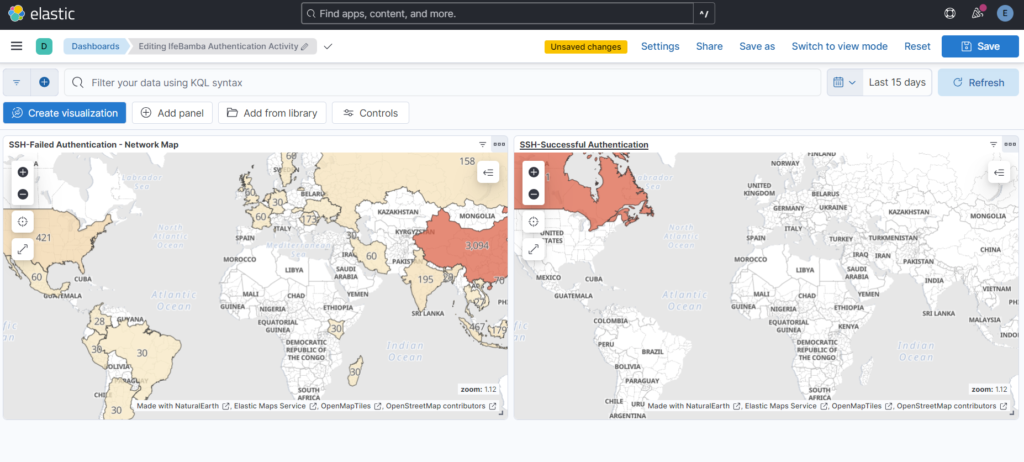
The Map is susccessfully added to our dashboard:
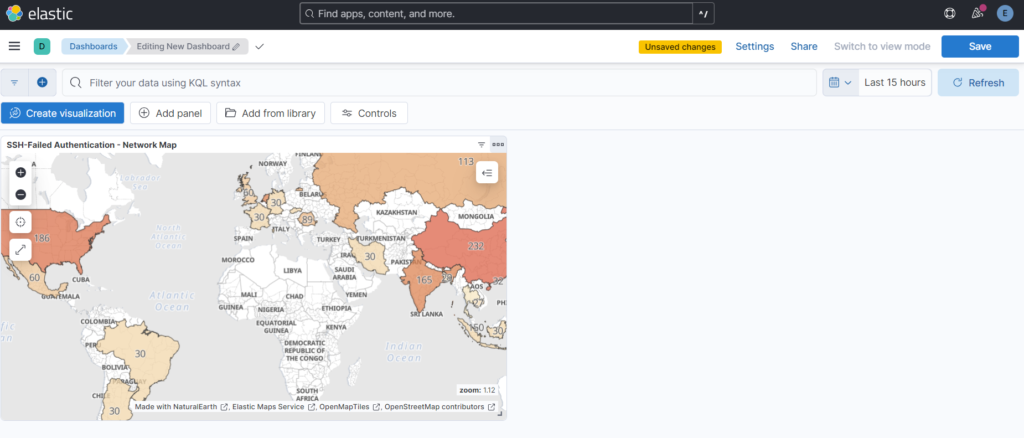
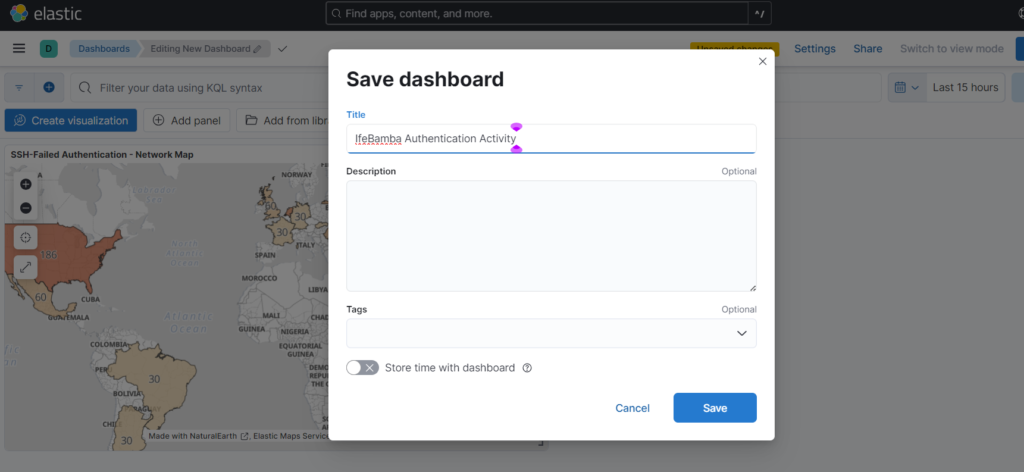
Click on Save to save the new Dashboard.
We can create a new map on our dashboard for successful SSH authentications.
Click on the duplicate option on the existing map;
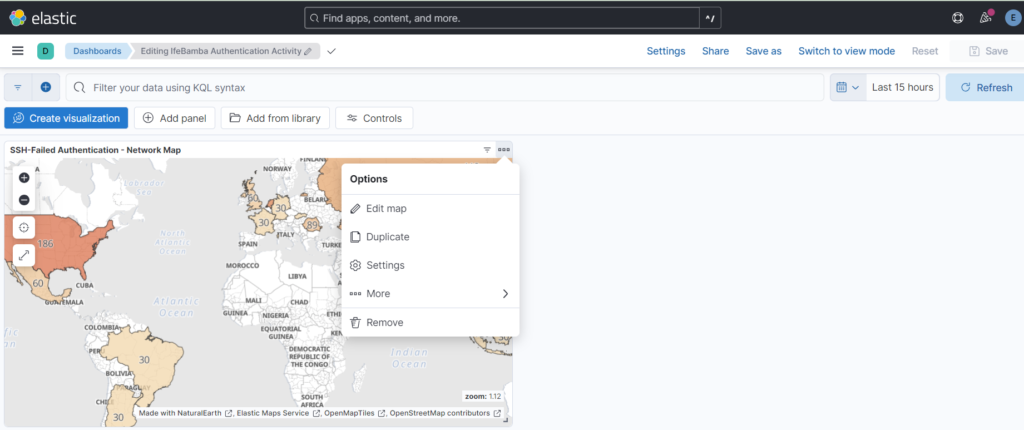
Once duplicated, edit the Name and Query:
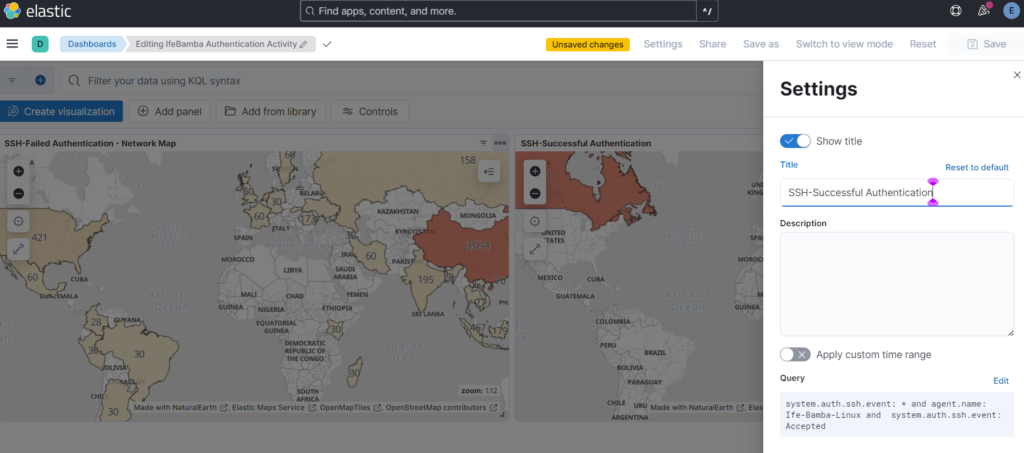
Edit the query from “Failed” to “Accepted”

Apply the changes, and change the date to last 15 days to capture our last successful ssh connection to the linux server:
