Installing the Kibana application component
We will install Kibana following the following steps
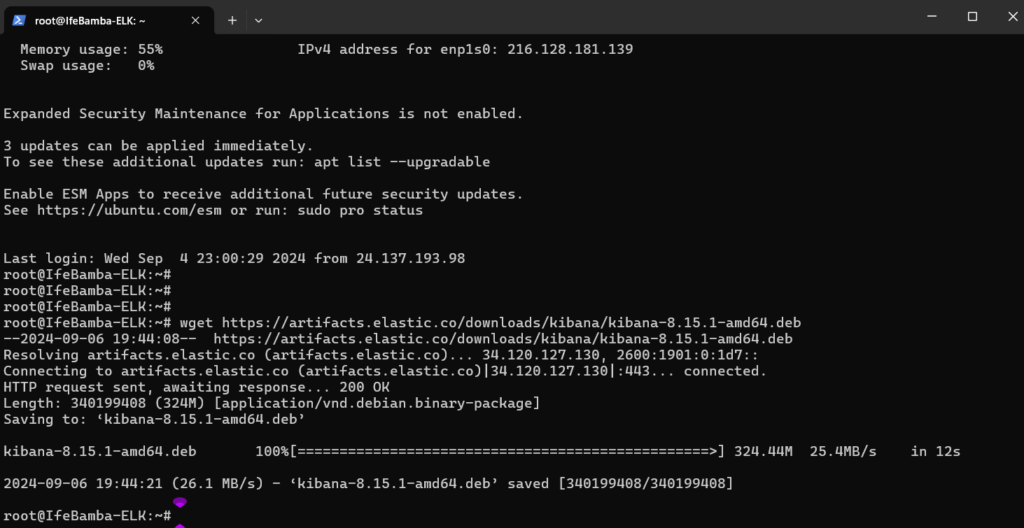
- Visit the download link: elastic.com/downloads/kibana
- Choose your platform, copy the download link
- Login into your ELK server terminal
- Download Kibana with WGET
- Install with dpkg -I <packagename>
- Configure the Kibana.config file located at /etc/kibana, edit the kibana.yml file
- Edit the configuration file Vi /etc/kibana/kibana.yml
The parameter fields to edit:
#server.port (uncomment)
server.host (use server IP)
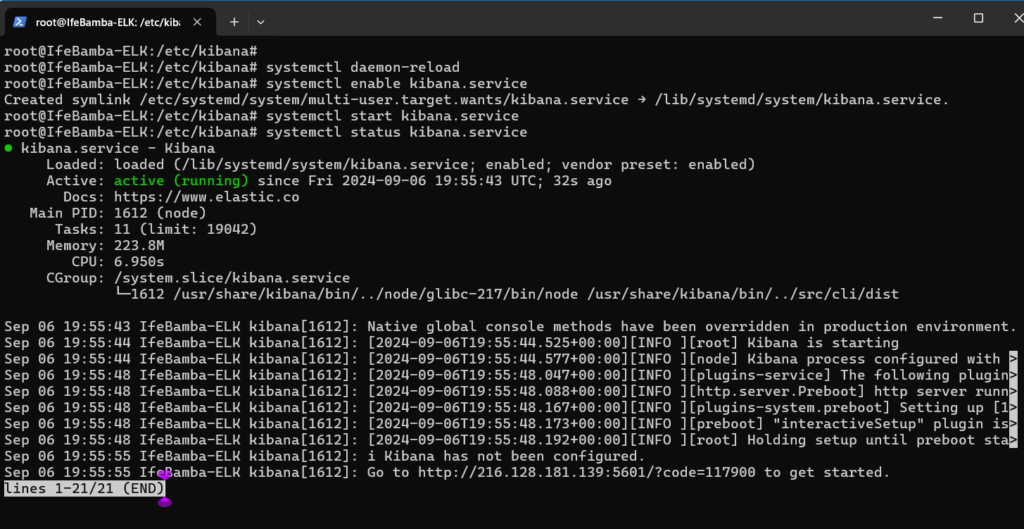
Reload the systemctl daemon, enable the service, start the service and check the status of the service.
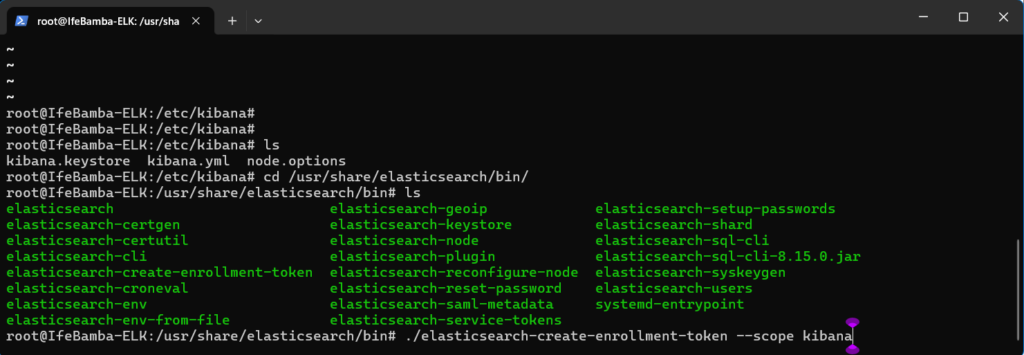
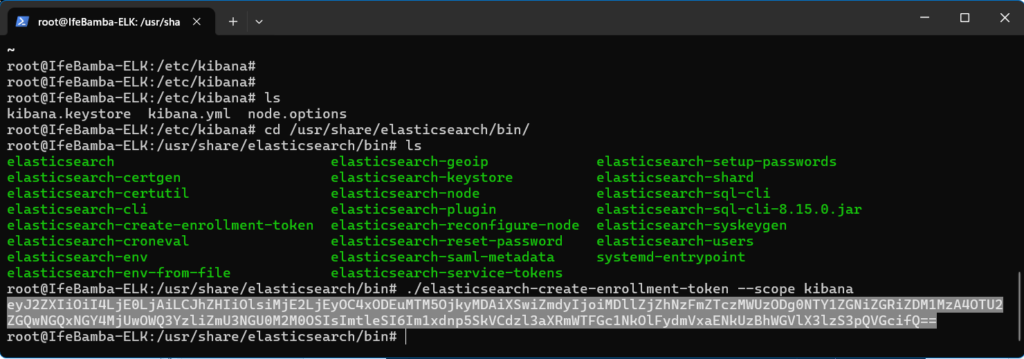
We need to generate an Elasticsearch enrollment token for Kibana:
To do this, we browse to the directory: /usr/share/elasticsearch/bin/
- Locate the binary file elasticsearch-create-enrollment-token (script)
- Run the command: ./elasticsearch-create-enrollment-token –scope kibana
A token will be generated. We need to keep it somewhere safe – probably in a notepad document for future reference as we will be using it soon.
Access Kibana via the web GUI at the url: HTTPS://<IPADDRESS>:5601
- 5601 is the port number of our Kibana Installation
The URL will most liekly be unreachable as below with an error message like below:

This application available on this port number 5601 is inaccessible because the firewall does not allow access to that port. We need to configure our cloud firewall under the network section in the Vultr cloud application to allow access to this port!
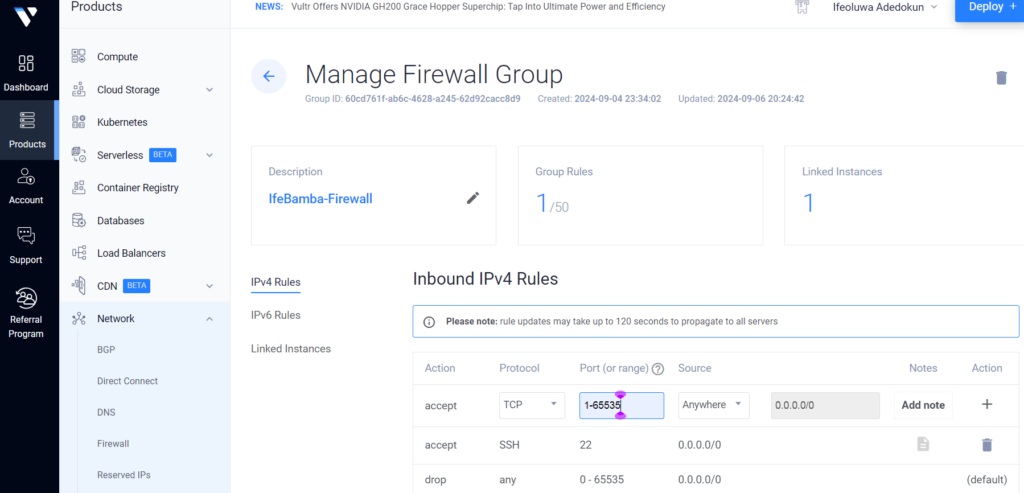
Above, we have added a firewall allow rule to the firewall to accept TCP connections to the server across all the port ranging from 1 – 65535. We could limit it only to the port in question 5601, but it falls within the range, so it works.
We also need to open the port on our ELK Ubuntu server to allow access to port 5601 using the uncomplicated firewall (ufw) command in linux:
> ufw allow 5601
* ufw: the uncomplicated firewall is a simple firewall management tool available on most Linux distros.

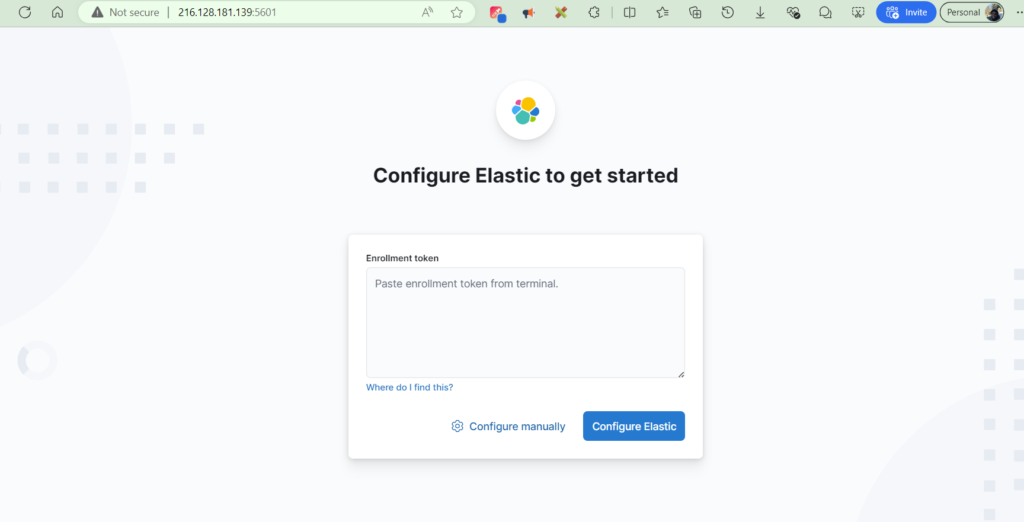
Next, we should be able to access our Elastic GUI as below, requesting a token code: Recall the token we saved in a notepad file earlier after we installed Elasticsearch, we will need to Paste in the enrollment token generated in previous steps into the page below:
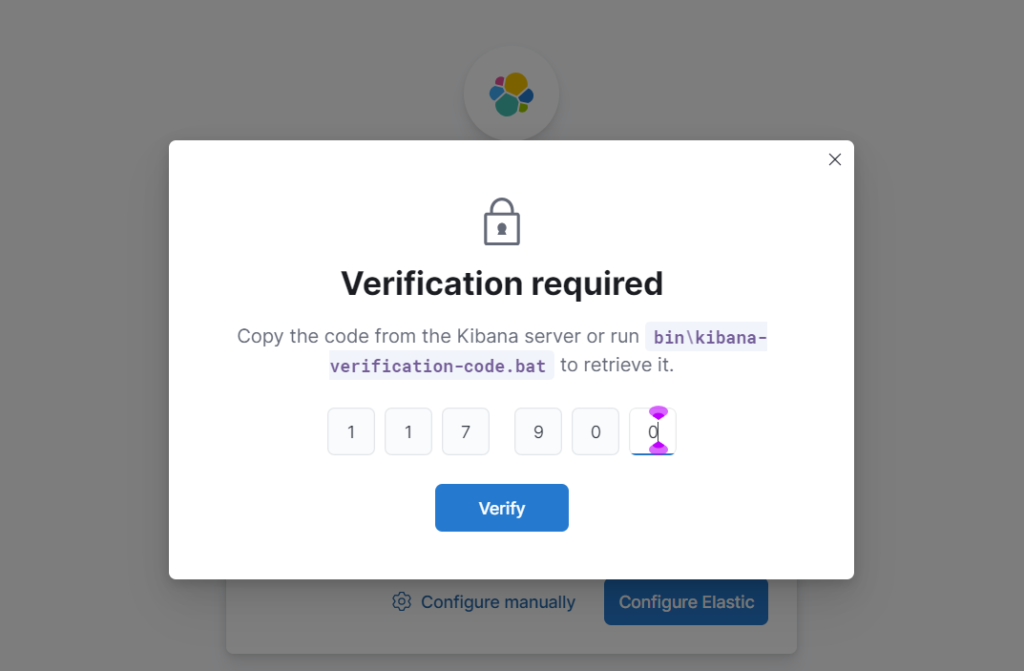
We will be required to copy in a verification code as described in the screen below…
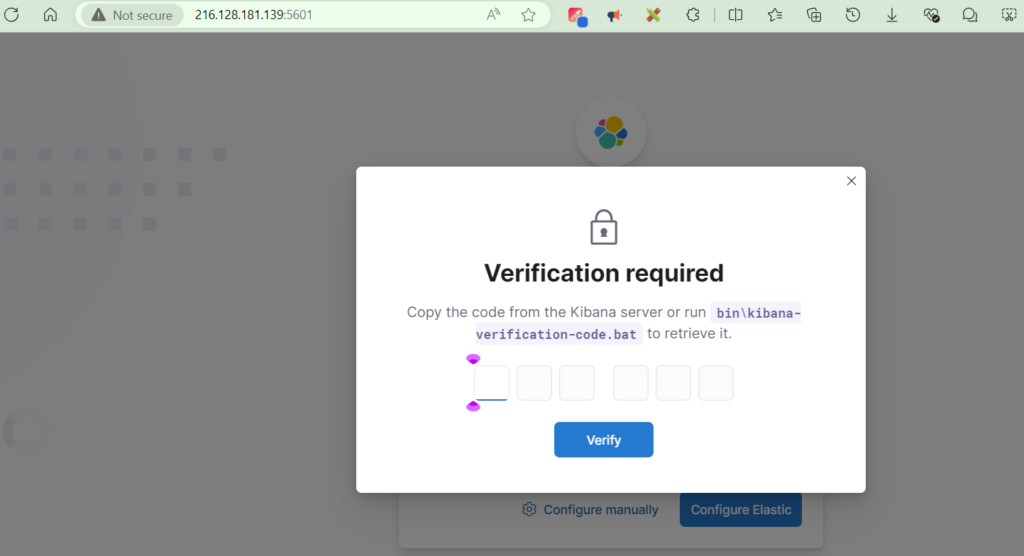
To obtain our verification code for Kibana, we run the script in the given url above:

- ./kibana-verification-code

The Elastic Login page!
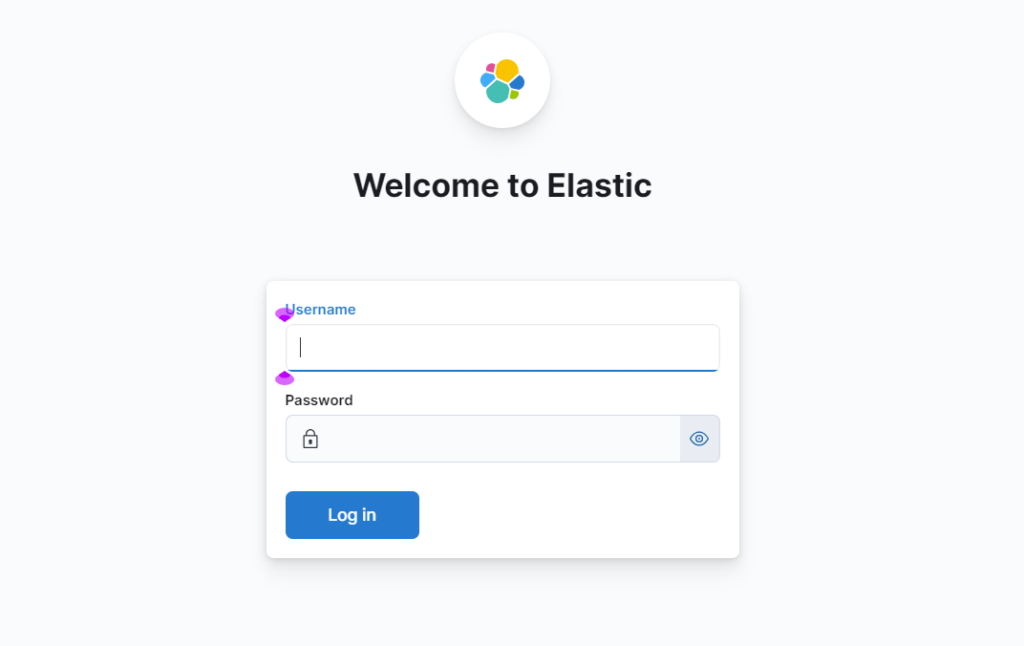
Username: elastic | Password: (superuser password generated after the installation of Elasticsearch)
After we login using the credentials, we should be able to access the dashboard
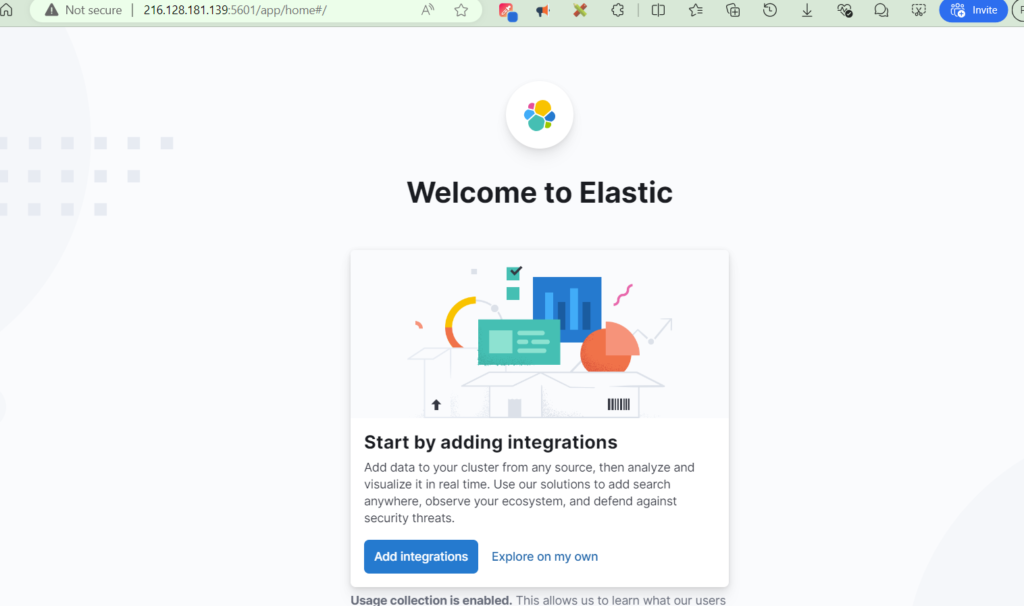
Dashboard:
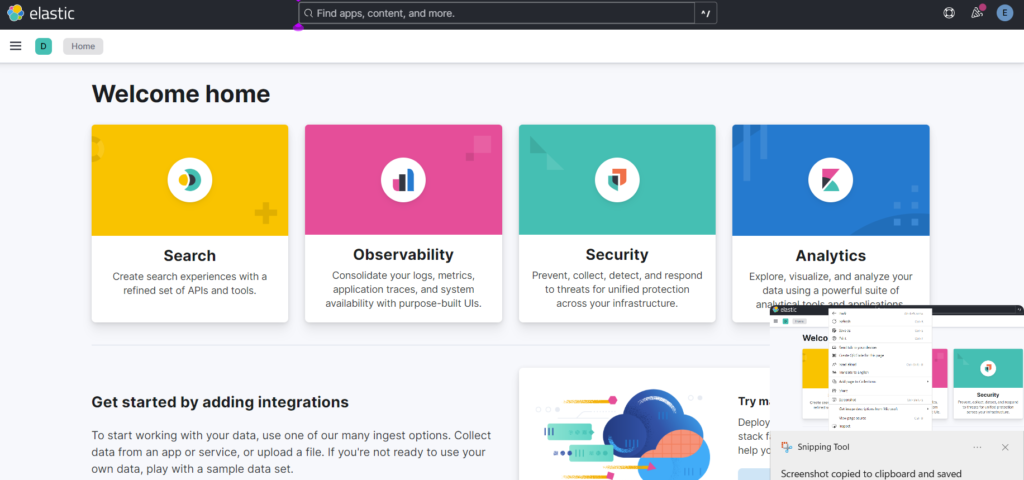
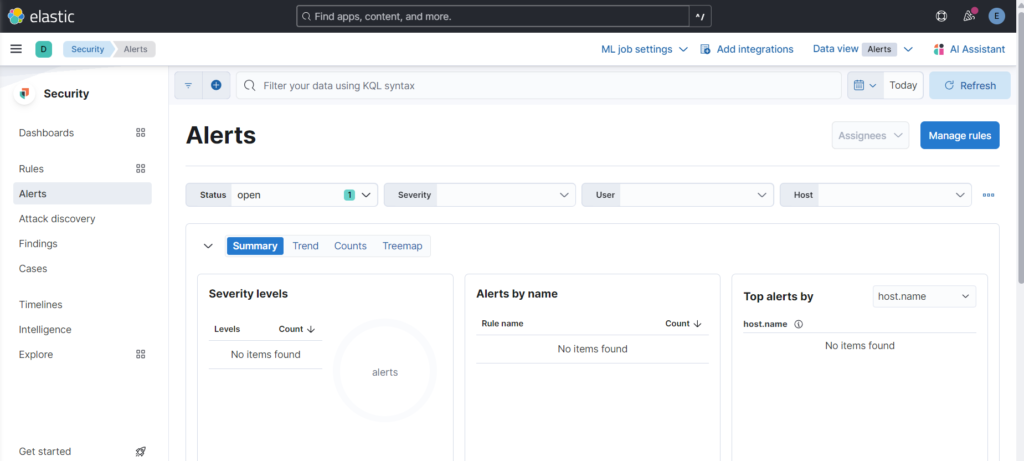
We need to setup an API integration key: Dashboard > Security > Alerts
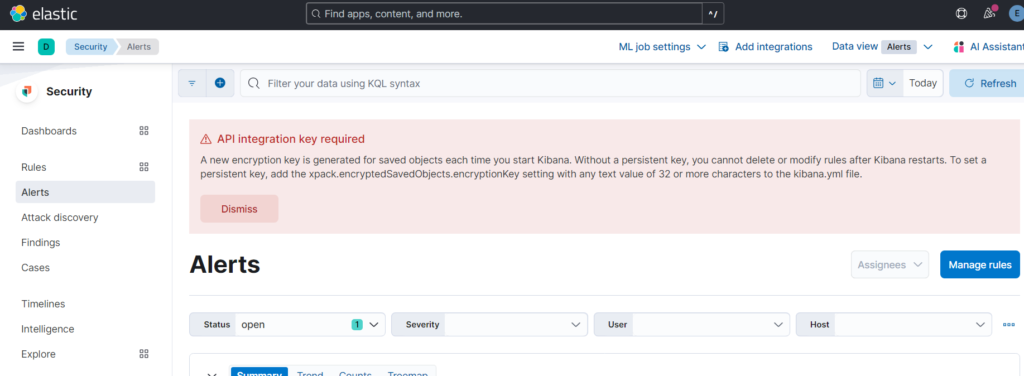
Browse: /usr/share/kibana/ and run the kibana-encryption-keys script file like so:

Encryption keys generated:
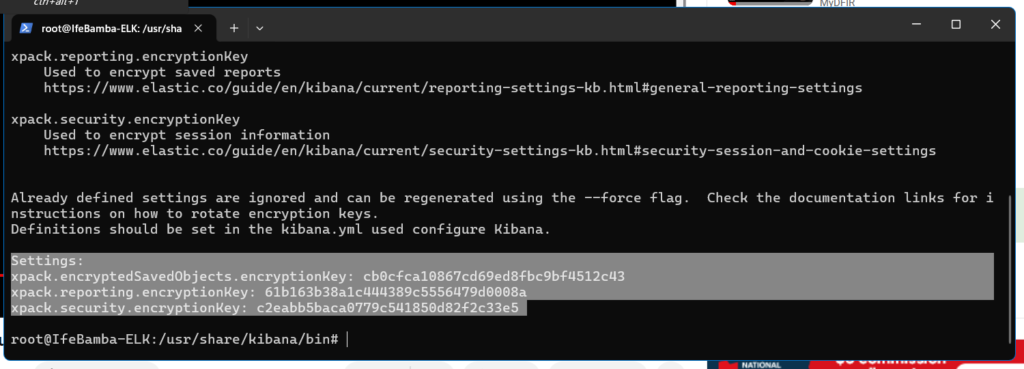
Next we use the kibana-keystore script In the same directory to utilize the encryption settings generated above:
./kibana-keystore add xpack-encryptedSavedObjects.encryptionkey, and enter the field value when prompted

Repeat the same for the other two settings:

Restart the kibana service with:
- systemctl restart kibana.service
API successfully configured:
